HOT TOPICS LIST
- Strategies
- Stocks
- Buy
- Investing
- Brokers
- Psychology
- Interviews
- Accumulate
- Sell
- Hold
- Spotlight
- Websites
- Candlestick Corner
- Gold & Metals
- Options Trading
LIST OF TOPICS
MARKET UPDATE
Wave Count 2006: Part 2
05/30/06 04:30:06 PM PSTby David Penn
This Elliott wave analysis of the cyclical bull market that began in the autumn of 2002 ends with a review and projection of the rally since the 2004 lows.
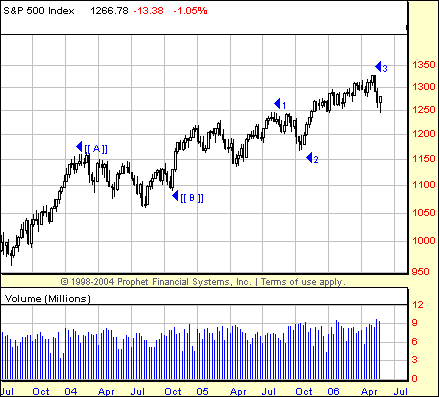
| NOW YOU "C" ME ... The ability to trace out a fairly clean series of five waves coming off of the August 2004 bottom was among the first clues that the final third of the cyclical bull market would take the form of a zigzag. While it is true that the wedgelike form of the market since August 2004 makes other sort of interpretations--such as a ending diagonal triangle--also possible, let's stick with the zigzag interpretation for the time being--as long as the market's movement remains consistent with the rules of zigzag corrections. What is a zigzag? In The Elliott Wave Principle, AJ Frost and Robert Prechter describe it thusly: A single zigzag in a bull market is a simple three-wave declining pattern labeled A-B-C. The subwave sequence is 5-2-5, and the top of wave B is noticeably lower than the start of wave A ... In a bear market, a zigzag correction takes place in the opposite direction ... For this reason, a zigzag in a bear market is often referred to as an inverted zigzag. If a flat correction represents a sort of standoff between buyers and sellers during a trend--recall that in the "standard" flat, all three legs of the A-B-C correction tend to be equal--then perhaps the zigzag represents those instances in a trend where countertrend forces are particularly aggressive. As Frost and Prechter note, not only is the top of wave B "noticeably lower than the start of wave A," but waves A and C tend to be significantly larger than wave B. Remember that in a bull market, a zigzag correction will feature two waves that are countertrend (A and C) and one wave that is protrend. The relatively larger size of the A and C waves is a testament to the countertrend forces at work during a zigzag correction. As a zigzag, the market from August 2004 to the present has moved in three legs or stages, each further subdivided into the 5-3-5 pattern mentioned previously. I have labeled the first part of the cyclical bull market from August 2002 to March 2004 wave A, the second part from March 2004 to August 2004 wave B, and the third part from August 2004 to the present wave C. Within wave C, I label the advance from August 2004 to March 2005 as wave (a), with wave (b) lasting one month from March 2005 to April 2005. Thus, since April 2005, I believe the market has been moving through a (c) of wave C. Within wave (c), there should be five waves with the first two waves already completed. The first of these two waves, wave 1, extends from April to September 2005. The second of these two waves, wave 2, lasted for one month from September through October 2005. The market since the October 2005 low has been enjoying its longest sustained rally without a significant correction since autumn 2003. As I have mentioned, this is a hallmark of a third wave and, since October 2005, the Standard & Poor's 500 has been in a third of a third--the most powerful section of any wave sequence. There is an argument against the zigzag interpretation, however. That argument is almost a footnote in a section on zigzags in the user manual for ELWAVE, software for spotting and creating Elliott wave counts developed by Prognosis Software Development. I have boldfaced parts of this description for emphasis: A Zigzag is the most common corrective structure, which starts a sharp reversal. Often it looks like an impulsive wave, because of the acceleration it shows. A zigzag can extend itself into a double or triple zigzag, although this is not very common, because it lacks alternation (the same two patterns follow each other). Notice that the zigzag can only be the first part of a corrective structure. Frost and Prechter are silent on this last point not mentioning this aspect of zigzag corrections in The Elliott Wave Principle, but it is worth considering. The cyclical bull market from the August 2002 lows has been a tripartite affair, an A-B-C correction that began with a variation on the expanded flat (A) and moved into an expanding triangle (B). I have cast the third leg of this A-B-C pattern as a zigzag because of what appear to me to be five waves up from August 2004 to March 2005. But if zigzags cannot conclude a corrective structure (again, assuming that the market since August 2002 has been one long "corrective structure"), then what other pattern could the market since the August 2004 lows be tracing? |
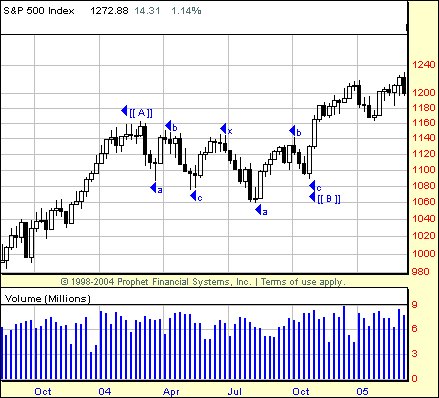
| In part 1 of this analysis, I discussed the most likely wave count for the first two legs of the cyclical bull market that began in the autumn of 2002. The October 2002-March 2004 market was marked as an expanding flat and I suggested the April-August 2004 market as an expanding triangle. This analysis of the final third of the A-B-C correction, the market advance out of the 2004 lows, will bring into question some of the earlier assertions about the March-August 2004 market in particular and provide two possible interpretations of the current C wave, a wave that is quite possibly hurtling toward a powerful conclusion. A TERMINAL TRIANGLE? An ending diagonal is a special type of wave that occurs primarily in the fifth wave position at times when the preceding move has gone "too far too fast" as Elliott put it. A very small percentage of ending diagonals appear in the C wave position of A-B-C formations. In double or triple threes ... they appear only as the final C wave. In all cases, they are found at the termination points of larger patterns, indicating exhaustion of the larger movement. Readers can see the attractiveness of the ending diagonal as an alternative to the zigzag in interpreting the market since the August 2004 lows. Frost and Prechter continue to say: Ending diagonals take a wedge shape within two converging lines. Each subwave, including waves 1,3, and 5, subdivides into a "three," which is otherwise a corrective wave phenomenon, producing an overall count of 3-3-3-3-3 ... A rising diagonal is bearish and is usually followed by a sharp decline retracing at least back to the level where it began.
Casting the market since August 2004 as an ending diagonal triangle means making some adjustments not just to the wave count since August 2004, but perhaps also in our interpretation of the B wave from March to August 2004. As an ending diagonal, per Frost and Prechter, then the market since August 2004 should consist ultimately of five, three-segmented waves. Because the zigzag interpretation of this period begins with a five-segmented wave (August 2004 to March 2005), the first leg of that five-segmented wave would instead be included as part of the March-August 2004 correction (making it, among other things, a March-October correction). This would accomplish a few things. First, it would make wave B a double 3 instead of an expanding triangle. The turning points of this a-b-c-x-a-b-c pattern (also written as a WXY pattern) would match up as follows: A: Late March 2004 Second, this change would make the move from the higher low in late October to the high in March 2005 a three-segmented wave rather than five (as was the case in the zigzag interpretation). Thus, the first of the five legs of the ending diagonal would be accurately cast with three distinct segments. Third, the April 2005 low, which is the bottom of wave (2) in the zigzag interpretation, would under the ending diagonal interpretation become either the first low in the three segments leading to the first of the five waves of the triangle, or is in itself the second wave low of the ending triangle. Because the first wave in a triangle tends to be the longest, I am more sympathetic to the former interpretation, which would make the October 2005 lows the end of the second wave of the ending diagonal triangle.
This interpretation brings us to the most recent trading in the S&P 500 and the establishment of yet another new high for the cyclical bull market that began in August 2002. Again looking to the technicals for support, there is a strong argument--in the form of negative divergences in key averages like the Russell 2000 and New York Stock Exchange, to say nothing of the S&P 500--that a top of some measure is being created in mid- to late April. If the current count is accurate (and this goes for both the zigzag and ending diagonal interpretations), then the top is likely to lead to a three-segmented correction and then a "final" top beyond the current highs. What makes the potential of an ending diagonal so worth noting is how such patterns are described in Elliott wave literature. As the Prognosis ELWAVE manual states, "usually diagonal triangles are followed by a violent change in market direction." Given the fact that the cyclical bull market is more than three and a half years old and that a number of indexes and averages such as the Dow Jones transports have been setting new all-time highs for the past several weeks, if not months, there is good reason to suspect that the August 2002-present bull market is long in the horn, if not in the tooth. |
| SUGGESTED READING ELWAVE User Manual, Prognosis Software Development. Frost, A.J., and Robert Prechter [1985]. Elliott Wave Principle, New Classics Library. Penn, David [2006]. "Wave Count 2006," Working-Money.com, April 26. |
Technical Writer for Technical Analysis of STOCKS & COMMODITIES magazine, Working-Money.com, and Traders.com Advantage.
| Title: | Traders.com Technical Writer |
| Company: | Technical Analysis, Inc. |
| Address: | 4757 California Avenue SW |
| Seattle, WA 98116 | |
| Phone # for sales: | 206 938 0570 |
| Fax: | 206 938 1307 |
| Website: | www.traders.com |
| E-mail address: | DPenn@traders.com |
Traders' Resource Links | |
| Charting the Stock Market: The Wyckoff Method -- Books | |
| Working-Money.com -- Online Trading Services | |
| Traders.com Advantage -- Online Trading Services | |
| Technical Analysis of Stocks & Commodities -- Publications and Newsletters | |
| Working Money, at Working-Money.com -- Publications and Newsletters | |
| Traders.com Advantage -- Publications and Newsletters | |
| Professional Traders Starter Kit -- Software | |
PRINT THIS ARTICLE

Request Information From Our Sponsors
- StockCharts.com, Inc.
- Candle Patterns
- Candlestick Charting Explained
- Intermarket Technical Analysis
- John Murphy on Chart Analysis
- John Murphy's Chart Pattern Recognition
- John Murphy's Market Message
- MurphyExplainsMarketAnalysis-Intermarket Analysis
- MurphyExplainsMarketAnalysis-Visual Analysis
- StockCharts.com
- Technical Analysis of the Financial Markets
- The Visual Investor
- VectorVest, Inc.
- Executive Premier Workshop
- One-Day Options Course
- OptionsPro
- Retirement Income Workshop
- Sure-Fire Trading Systems (VectorVest, Inc.)
- Trading as a Business Workshop
- VectorVest 7 EOD
- VectorVest 7 RealTime/IntraDay
- VectorVest AutoTester
- VectorVest Educational Services
- VectorVest OnLine
- VectorVest Options Analyzer
- VectorVest ProGraphics v6.0
- VectorVest ProTrader 7
- VectorVest RealTime Derby Tool
- VectorVest Simulator
- VectorVest Variator
- VectorVest Watchdog


