HOT TOPICS LIST
- Strategies
- Stocks
- Buy
- Investing
- Brokers
- Psychology
- Interviews
- Accumulate
- Sell
- Hold
- Spotlight
- Websites
- Candlestick Corner
- Gold & Metals
- Options Trading
LIST OF TOPICS
INVESTING
Beta Mutual Funds: Do They Make Cents?
06/05/06 03:34:52 PM PSTby Norman J. Brown
How well do beta mutual funds work?
| I analyzed seven "beta" mutual funds, of at least five years' lifetime, to determine how well they performed compared to their stated goals. Beta is a measure of risk and is commonly applied to evaluate mutual funds. Its value indicates the amount of volatility in relation to the underlying index fund. Three earlier companies pioneered this approach using mutual funds: Rydex, Potomac, and Profunds. My conclusions from that study, performed using Investors FastTrack software, is that such a beta concept leads to disappointing results, at least over the time period studied. Here, I will summarize the data and analyze the reasons for the poor performance. BACKGROUND Let's take a simple case for the annual return of the S&P 500 and see what the effect would be of doubling all daily returns. Suppose the up day (average) ROC is +1% and the down day (average) ROC is -1%, and over a year, there are 131 up days and 121 down days (with an up day bias 52%), yielding a net 10 up days (a typical value for index mutual funds), then the annualized gain (ANN) is: ANN (index) = (1.01)^10 = 1.1046 or 10.46% Thus, doubling by a beta of 2 has the effect of raising the (perfect) beta fund ANN by the square (which is greater than a double). So instead of investing in the S&P 500 (as you can in Vanguard using VFINX), you can (in principle) more than double your gain by buying RYCTX. In fact, Rydex will tell you its goal is to double the everyday ROC, but of course they do not promise a square rate increase in ANN. This is understandable, as they have a difficult task to replicate; at the end of each day, a ROC value that changes randomly day by day. They attempt to do this by buying options, futures, and swaps to try to properly leverage the daily ROCs to the goal value. This sophisticated approach is complicated, since every day, they have to settle the overall equity as investors are constantly buying and selling, and there are costs associated with all such turnovers. These three companies also state that increasing beta increases the standard deviation, thus increasing the risk, although they do not quantify that risk. In my mind, this makes the true danger associated with such funds obscure to the investor, a task I will try to make clear.
|
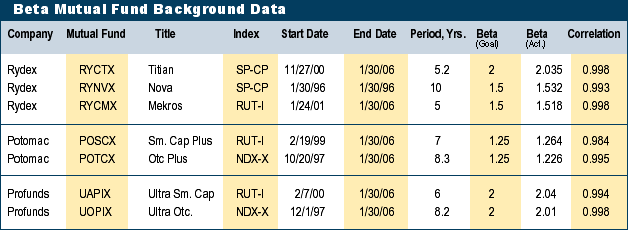
| LOOKING AT SOME DATA Figure 1 summarized the seven beta funds I found in my FastTrack database that have greater than five years' duration. These seven funds offer a beta ranging from 1.25 to 2 and use three different underlying index funds: SP-CP (S&P500 or SPY), RUT-I (Russell-2000, Small Cap), and NDX-X (NASDAQ or QQQQ). I set two basic goals, one to replicate an up return beta (for example, doubling the ROC) every up day and, of course, every down day as well. In practice, it is not possible to do that, so some up days are "lost" and even reversed, such that the net up days for a given year are not perfectly preserved (in fact, they are generally lowered). A measure of this is the correlation term, which indicates how the beta fund replicates the number of up and down days. Even though the correlation has, apparently, a very high correlation (the order of 98% or more), this small change from 100% can lead to a deterioration of the desired ANN (as will be explored subsequently). A second, and even more difficult requirement, is to try to replicate the up and down ROCs values as precisely as possible every day. In my Working-Money.com article (October 7, 2005) entitled "The Effects Of Tilt On Mutual Fund Investing," I defined "tilt" (the difference between the up day ROC minus the down day ROC) and showed that, in general, it is of negative value leading to a significant reduction in the desired (no tilt) ANN. Here, I will show in the subsequent data for the beta funds that the beta process exacerbates this problem and is the major reason why the beta ANN falls well short of the theoretical square rate enhancement goal. As an aside, these two goals can be thought of as analogous to a high-fidelity amplifier that would need to have a high level of amplitude as well as good reproduction of frequency (of time). If this didn't occur, distortion would be introduced.
|
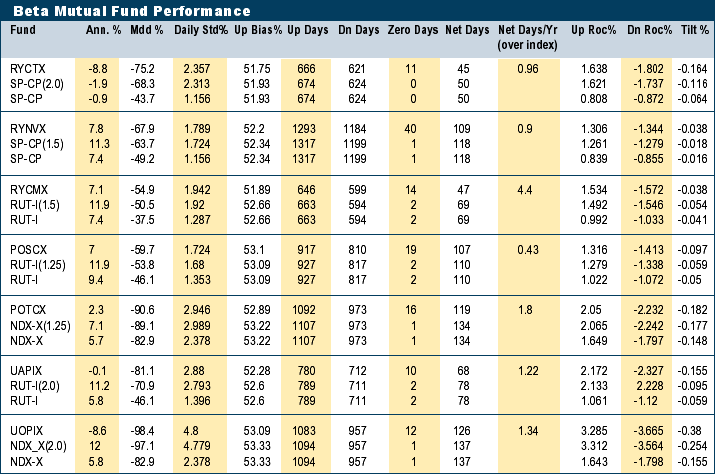
| Figure 2 presents the basic parameters measured for the seven beta funds, their (theoretical) calculated goals, and the parameters for the index fund to be replicated. Let's look at fund 1, RYCTX, as an example. The first thing you see is that its ANN of -8.8% falls far short of its theoretical value of -1.9%, a compound loss of -7%. Even more disconcerting is that the MDD (maximum drawdown of equity) of -75.2% far exceeds the index value of -43.7% and even exceeds the theoretical MDD of -68.3%. At this point, I should point out a key difficulty associated with beta funds. It is mathematically true that with 100% correlation and exact replication of all ROCs that the ANN for a beta of 2 will increase as the square (as previously explained), but, probably, unknown to beta fund investors, the MDD will also increase at a square rate. For example, if the index has an MDD of -50% (0.5 of equity), then a "perfect" beta 2 fund would have an MDD of -75% (0.5^2 = 0.25 of equity). This is something that the mutual fund people do not make clear: the beta fund could have more than twice the standard deviation (implying over twice the risk), but that does not convey the more worrisome message that the MDD could deteriorate at a square rate (in fact, as can be seen from the data, the actual funds always exhibit more than the theoretical MDD). This example of gain associated with a 1% ROC illustrates that the buy & hold ANN is proportional (actually resulting in a square rate output) to the net up days in a year. How well do the beta funds replicate the net up days? Fund 1 does well, missing only one day over a year (accounting for its very nice 0.998 correlation to SP-CP), but as each day, on average, has a ROC of 1.6% that represents a loss of about -1.6% to the ANN. For fund 3, a net difference of 4.4 days with an average ROC of 1.5% results in a much greater loss of -6.6% compared to theoretical. It is now obvious that a non-100% correlation leads to a reduction in the beta fund ANN. Another difficulty is illustrated with fund 1, exhibiting a tilt of -0.164%. This would not be a problem if the theoretical fund had the same tilt, but beta SP-CP has only a -0.116% tilt. This means that the beta fund has created an additional beta tilt of -0.048%, which (shown later) results in another -5.6% loss in ANN over the theoretical. These are the two main effects I have found leading to the poor ANN performance of the beta funds, resulting in a deterioration ranging from -7% to -18.4% ANN for the seven funds studied. This performance is so poor that we would be better off staying in the non-beta index funds, particularly when MDD is taken into account. With our emphasis now on MDD, look at fund 7 (UOPIX), which has the inevitable task of replicating the NASDAQ (dominated by volatile high-tech stocks), a devastating MDD of -98.4%, a result that would clearly destroy any portfolio unfortunate enough to hold such a fund over the period March 27, 2000, to October 7, 2002, the recent bear market period. Even though this fund has an additional five years more than the MDD period, it still could not achieve a positive ANN, even though its beta surrogate does. The reason, an excessive tilt of -0.126%, which spread over 117 down days per year, results in a -14% loss compared to the surrogate gain of 12.4%, a most distressing result.
|
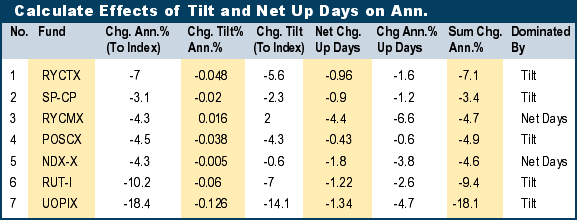
| Figure 3 summarizes the two effects noted (net day difference and negative tilt) for the seven beta funds indicating that five of the seven beta fund losses is attributed to the excessive negative tilt, whereas funds 3 and 5 are dominated by a loss of net days, creating the undesired loss of ANN. Interestingly, only fund 3 had a slightly positive tilt, somewhat offsetting the loss due to large 4.4-net day reduction. One reason for the generation of negative tilt is the effect of fund expense on both positive and negative ROC. Suppose the positive day beta (up day performance only) is exactly 2.0 and the negative day beta (down day performance only) is also 2.0. There should be no additional tilt term introduced. But now, at the end of each day, the mutual fund company imposes its operating expense (applied to equity), which has the effect of reducing the positive ROC by a small amount and increasing the negative ROC by a similar small amount. This effect can be thought of as decreasing the positive beta and increasing the negative beta, generating a net negative beta differential. This effect is either added to or slightly suppressed by the variable daily beta, resulting in the final resulting net tilt. It is little wonder this net tilt is usually negative. Undoubtedly, the recent bear market has contributed to the difficulties that the beta funds encountered over the period studied. I can imagine a huge number of sell orders causing all kinds of chaos (expense) within those companies. To take a more favorable period, I looked at a post-bear market period from October 9, 2002, to January 30, 2006, for Rydex's Nova fund, RYNVX, with improved results for ANN/MDD: RYNVX 25.2%/-22.1% Here there is an improvement in ANN, with a higher but tolerable MDD. This illustrates that, with caution (and perhaps such luck), you could invest in such a beta fund as long as you don't go off to Hawaii for long periods and lose sight of the investment. CONCLUSIONS SUGGESTED READING -Rydex (rydexfunds.com) |
Norman J. Brown is a retired electrical engineer and private investor. He may be reached at njb.nb@verizon.net.
| E-mail address: | njb.nb@verizon.net |
PRINT THIS ARTICLE

Request Information From Our Sponsors
- StockCharts.com, Inc.
- Candle Patterns
- Candlestick Charting Explained
- Intermarket Technical Analysis
- John Murphy on Chart Analysis
- John Murphy's Chart Pattern Recognition
- John Murphy's Market Message
- MurphyExplainsMarketAnalysis-Intermarket Analysis
- MurphyExplainsMarketAnalysis-Visual Analysis
- StockCharts.com
- Technical Analysis of the Financial Markets
- The Visual Investor
- VectorVest, Inc.
- Executive Premier Workshop
- One-Day Options Course
- OptionsPro
- Retirement Income Workshop
- Sure-Fire Trading Systems (VectorVest, Inc.)
- Trading as a Business Workshop
- VectorVest 7 EOD
- VectorVest 7 RealTime/IntraDay
- VectorVest AutoTester
- VectorVest Educational Services
- VectorVest OnLine
- VectorVest Options Analyzer
- VectorVest ProGraphics v6.0
- VectorVest ProTrader 7
- VectorVest RealTime Derby Tool
- VectorVest Simulator
- VectorVest Variator
- VectorVest Watchdog


