HOT TOPICS LIST
- Strategies
- Stocks
- Buy
- Investing
- Brokers
- Psychology
- Interviews
- Accumulate
- Sell
- Hold
- Spotlight
- Websites
- Candlestick Corner
- Gold & Metals
- Options Trading
LIST OF TOPICS
SECTOR SPOTTING
Betting On Biotech
06/13/06 03:54:01 PM PSTby David Penn
What happens when you combine the promise of cutting-edge technology with the insights of 21st-century biology? How about a biotechnology sector that is primed for growth?
| It's often been said that on Wall Street, "growth" is like crack cocaine: smart money is obsessed with it, and once it gets a taste, it can't get enough. And don't come %91round with any imitations or flawed product, neither. If it ain't real, revenue-increasing, puro growth that your stock is delivering, then don't even bother darkening the doorstep of your average Wall Street trader or money manager. Those bearing knockoffs and accounting-enhanced gimmickry need not apply. That said, it is hard to imagine a sector of the economy that is better built to exploit this tendency toward addiction than the biotechnology sector. When I first wrote about the biotechnology sector for Working-Money.com years ago ("Biotech To The Future!" May 1, 2001), biotechnology was in correction mode following the market peak in 2000 and subsequent dotcom and telecom implosion. From that point, in most respects, biotechnology stocks followed the rest of the market into the bear market lows of late 2002. Since then, biotechnology as a sector has rallied strongly as a cyclical bull market in stocks has been the tide that has raised all boats. But biotechnology also has been the place to go for those traders, speculators, and investors looking to leverage and maximize the positive climate and optimistic psychology of a bull market.
Such climates and psychology, it could be said, are especially relevant to biotechnology companies. Like dotcoms, telecoms, and other corporations attempting to leverage technology to create products and services that were often unimaginable before, biotechnology companies exist in a world of hope and aspiration as much--if not more--as they exist in a world of balance sheets and politics. As many of the biotechnology mutual fund managers I spoke with back in 2001 pointed out, the path of a new drug or treatment from research and development through initial trials and ultimately to market is fraught with stumbling blocks, hurdles, and hazards. And unfortunately, each obstacle provides plenty of opportunity for the hopeful to indulge their most passionate fantasies of breakthrough cures and for the fearful to worry their darkest fears of failed test results--or far worse, proof that the product in question violates the central tenet of all health care: first, do no harm. |
| SECTOR RECAP "Do no harm" might as well be the central tenet of all investing, and a tenet more commonly expressed as "Protect your capital." One of the ways of protecting capital and managing risk is to trade and invest in stocks as they become favored by the business cycle. As I have written recently for Working-Money.com ("Counting On Consumers" and "Smoke Rising"), the business cycle favors certain stocks at certain times. When inflation is ramping higher, as I noted in "Smoke Rising," not only do commodities tend to outperform, but so do those industries most closely related to commodity procurement, production, and processing. The %A8uber example, of course, is the oil sector, but outperformance can also be found in gold stocks, construction stocks, and basic industry. As the cliche goes, buy anything with a smokestack. But when inflation has gotten out of control, this picture changes. And efforts to reign in inflation--most notably those efforts of the Federal Reserve Board--result not only in falling commodity prices (and falling "commodity stocks"), but also in declining growth rates as the economy cools off. This cooling-off period might be healthy for the economy, but it is no picnic for most stocks. As such, as I wrote in "Counting On Consumers," investors tend to move away from the inflation and commodity stocks toward what have been called the "recession stocks." These stocks are those whose products and services are more or less always in demand, and thus, the fortunes of the companies (and their stocks) are less tied to the up-and-down nature of the economy and the business cycle. If peak economic performance means it is time to buy smokestack stocks, then the first suspicions of an economic slowdown will bring the bids to the shares of companies whose products are more likely found in your kitchen cupboards and bathroom cabinets.
|
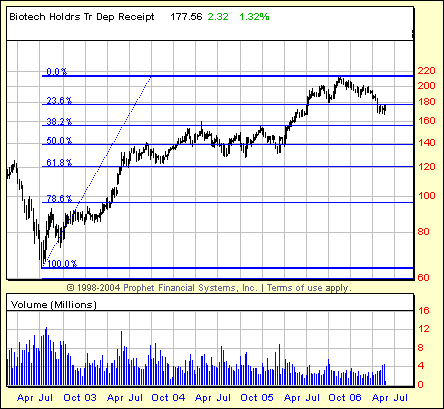
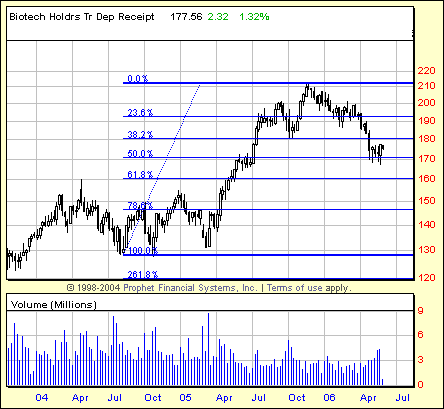
| Recession stocks do well in the early stages of an economic contraction or slowdown. But once the slowdown is under way, there really is little place in the equities markets to hide. Some opt for the sort of high-paying dividend stocks that can be found in the utilities sector. But even this is more of a defensive play than an investment made in hopes of significant capital appreciation. Instead, what some sector traders do is look beyond the late contraction stage to the resumption of the positive turn of the cycle: the early expansion stage at which growth stocks--such as biotechnology stocks--have recovered from the cooling period and are more than ready to heat up. BIOTECH BELIEVERS The correction in biotechnology stocks has seen the BBH fall from 210 back to 170 from November 2005 to the end of May 2006. The severity of this correction depends on your point of reference. From the point of view of the entire cyclical bull market from late 2002, the current correction in biotech stocks has retraced a little over 25% of the move from about 65 in late 2002. From the point of view of the most recent intermediate-term lows--the October 2004 lows--the current correction has retraced just shy of 50% of the move. In both cases, however, an argument can be made that biotechnology stocks have corrected enough of their previous movement to be able to move higher from current levels if investor sentiment returns to their side.
|
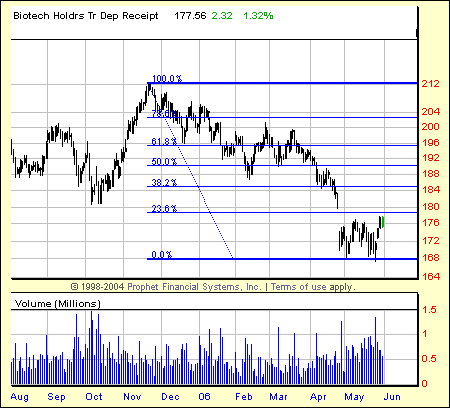
| Looking at a chart of the decline from the November top, the BBH is testing the resistance near 178--a 25% retracement level. A strong close above this level would not only set up a possible run on the next significant resistance level, namely the 184 level that corresponds to a Fibonacci 38.2% retracement level, but also would come close to closing a sizable gap created as the BBH plummeted in the spring of 2006. This five-point gap between 175 and 180 remains significant resistance on the daily chart and will be an important first hurdle if the biotechnology stocks are to head higher. Which stocks might benefit disproportionately from a market that decides to take a bet on growth and optimism about the second half of the year? Looking at biotech stocks with the same approach I used to examine consumer stocks in my last "Sector Spotting" article, I searched for instances when biotechnology stocks made key lows in late April or early May. These charts don't have to resemble that of BBH--in fact, it would be preferable if at least in some instances they did not. Ideally, a biotechnology stock in an uptrend that merely corrected in late April or early May would be the preferred vehicle to ride higher any bounce in biotechnology stocks. Many biotech stocks mirror the path of the BBH, most notably Amgen (AMGN), which makes up about 25% of the biotechnology HOLDRS. But another biotechnology powerhouse that makes up about 40% of BBH, Genentech (DNA), is also making the sort of patterns that might be consistent with a near-term low. DNA has been in a downtrend since topping out in December 2005--a month after the BBH topped out. After a closing high just shy of 100, DNA proceeded to slide almost without interruption for the next several months before bouncing--very powerfully, but very briefly--in mid-March at 82. The short-lived bounce completed, DNA continued its decline, last finding support at the 76 level--lows not seen since the late spring of 2005.
|
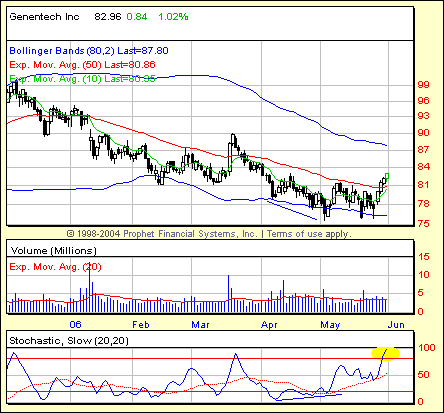
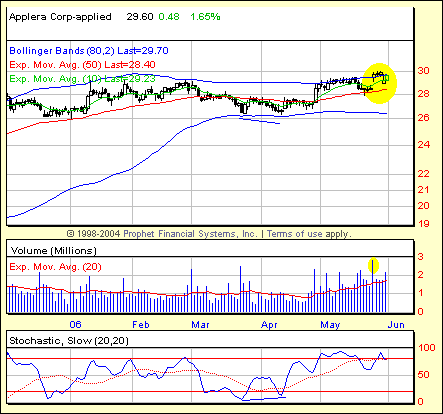
| April appears to have been a bottoming month for DNA. As Figure 4 shows, DNA has began making higher lows in its stochastic during that month while prices were still declining. May saw DNA move sideways--albeit with a new closing low for the decline--but most of the above-average volume days in May for Genentech accompanied "up" days, a positive sign. In addition, Figure 4 shows my BOSO screen (see my Working-Money.com article, "BOSO," from October 5, 2005) that looks to highlight oversold and overbought trends that still are worth taking advantage of. Here, DNA has made a stochastic breakout (that is, moving above 80 into "overbought territory"), further suggesting strength in the stock as it attempts to rally off its current lows. Note that this move to a stochastic breakout also finds DNA closing above its 50-day exponential moving average (EMA) for the first time since mid-March. An example of a biotech stock in an uptrend that may have undergone worthwhile distribution during its April/May decline in preparation for a move higher is Applera Corp. (ABI). Going back several months, ABI's chart (Figure 5) shows a stock that has not suffered at all as other biotech stocks have. Applera has been in bull market mode since the summer of 2005, and the corrections that have brought significant retracements to DNA and BBH have been true buying opportunities for ABI. ABI largely moved sideways from November 2005 to April 2006, trading in a range that was three points wide at its broadest point. But compared to the declines--especially in 2006--that other biotechs have suffered, the trading range in ABI was a veritable port in a biotech storm.
Focusing in on ABI's chart over the past few months--again using the BOSO screen--we noticed that the Bollinger Bands tightened over the second half of March and through April. Such tightening of the Bollinger Bands tends to reflect a drop in volatility, the kind of drop that often anticipates a significant move. While this alone provides no clue as to potential directionality, there are other clues--including the prevailing uptrend--that support the idea that ABI will head higher before heading significantly lower. One of these clues is the positive stochastic divergence between the mid-March and early April lows. The fact that the stochastic made higher lows while the stock made lower lows suggests that downside momentum--even in a largely sideways consolidation--is waning. Already, ABI is showing signs of having responded to this positive divergence by rallying back to the upper Bollinger Band and, in recent days, breaking out above that level on impressive volume. DO NO HARM Being ready to buy stocks in out-of-favor sectors is not the easiest move to make in the trading or investing world. But such moves are the essence of market timing, which has been proven again and again as the key to making money in the financial markets. Hong Kong-based Swiss money manager Marc Faber once observed in an interview that a truly savor investor could have made three investment decisions over the past 30-odd years that would have netted a fortune: buying gold in 1970, selling gold and buying Japanese stocks in 1980, and selling Japanese stocks and buying US stocks in 1990. I suppose we could add, selling US stocks in 2000 and buying US real estate. But that would be piling on. What is important is that the speculator's holy grail isn't a method, it is a moment (an "exquisite moment," as Jim Cramer, money manager and host of CNBC's Mad Money, put it when he called the bottom in 2003 in the weeks leading up to the invasion of Iraq). As Faber's fantasy list of perfectly timed investments makes clear, "exquisite moments" tend to arrive after extended, often miserable declines. No one was interested in gold in the late 1960s and early 1970s; in 1961, Americans were forbidden from holding gold even in foreign accounts. It was not until the end of 1974 that Americans were allowed to own gold (other than jewelry, of course). No one was interested in Japanese stocks in 1980 or US stocks in 1990. So there is an element of bottom-fishing involved when looking for moments of exquisite--or at least profitable--investment. There's no telling how exquisite this moment might be for the high-flyers (and low-divers!) of the biotechnology group. But if there is a bet to be made on both the opportunities of technological innovation and the challenges of medical science--as well as a bet on a recovering business cycle--then it is hard to conceive of a place in the market with greater promise than biotech. SUGGESTED READING |
Technical Writer for Technical Analysis of STOCKS & COMMODITIES magazine, Working-Money.com, and Traders.com Advantage.
| Title: | Traders.com Technical Writer |
| Company: | Technical Analysis, Inc. |
| Address: | 4757 California Avenue SW |
| Seattle, WA 98116 | |
| Phone # for sales: | 206 938 0570 |
| Fax: | 206 938 1307 |
| Website: | www.traders.com |
| E-mail address: | DPenn@traders.com |
Traders' Resource Links | |
| Charting the Stock Market: The Wyckoff Method -- Books | |
| Working-Money.com -- Online Trading Services | |
| Traders.com Advantage -- Online Trading Services | |
| Technical Analysis of Stocks & Commodities -- Publications and Newsletters | |
| Working Money, at Working-Money.com -- Publications and Newsletters | |
| Traders.com Advantage -- Publications and Newsletters | |
| Professional Traders Starter Kit -- Software | |
PRINT THIS ARTICLE

|

Request Information From Our Sponsors
- StockCharts.com, Inc.
- Candle Patterns
- Candlestick Charting Explained
- Intermarket Technical Analysis
- John Murphy on Chart Analysis
- John Murphy's Chart Pattern Recognition
- John Murphy's Market Message
- MurphyExplainsMarketAnalysis-Intermarket Analysis
- MurphyExplainsMarketAnalysis-Visual Analysis
- StockCharts.com
- Technical Analysis of the Financial Markets
- The Visual Investor
- VectorVest, Inc.
- Executive Premier Workshop
- One-Day Options Course
- OptionsPro
- Retirement Income Workshop
- Sure-Fire Trading Systems (VectorVest, Inc.)
- Trading as a Business Workshop
- VectorVest 7 EOD
- VectorVest 7 RealTime/IntraDay
- VectorVest AutoTester
- VectorVest Educational Services
- VectorVest OnLine
- VectorVest Options Analyzer
- VectorVest ProGraphics v6.0
- VectorVest ProTrader 7
- VectorVest RealTime Derby Tool
- VectorVest Simulator
- VectorVest Variator
- VectorVest Watchdog

