HOT TOPICS LIST
- Strategies
- Stocks
- Buy
- Investing
- Brokers
- Psychology
- Interviews
- Accumulate
- Sell
- Hold
- Spotlight
- Websites
- Candlestick Corner
- Gold & Metals
- Options Trading
LIST OF TOPICS
TRADER'S NOTEBOOK
Beat The Business Cycle
06/28/06 05:02:12 PM PSTby Rudy Teseo
Intermarket analysis has been around for a while, and bears occasional review.
| You may only be trading in securities with no thought of ever trading commodities, or bonds, but the interaction of these markets (commodities, bonds, stocks) on each other plays a direct role in the movement of those securities. John Murphy first brought the need for this type of analysis to everyone's attention more than a decade ago with his classic book Intermarket Technical Analysis. In his later book, The Visual Investor, there is a chapter entitled "Market linkages" that is still my primary source of review on the subject. In addition to those three instruments, we cannot overlook currency trading. What prompted me to write this article is the tremendous upsurge in currency trading we have seen this past year and my own entry into this arena. I found myself needing to study the effects of economic changes, both home and abroad, on currencies. |
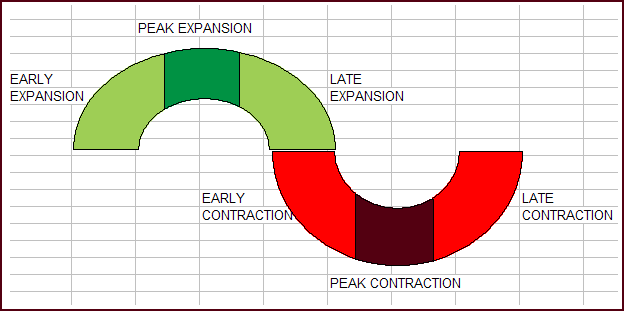
| THE BUSINESS CYCLE You must appreciate that there is more to investing than just studying a company's fundamentals and following its progress with a chart or two. As you delve more and more into this interaction, you become aware of how the changing business cycle causes sector rotation and the impact it has on your asset allocation. (You do have an asset allocation model, don't you?) Market timing is a strategy that relies on the use of proprietary, quantitative, statistical analysis, and/or technical indicators to alert the investor to when the market may be turning. Being aware of where we are in the ever-changing business cycle, and which instruments are changing from up to down, must also be part of that strategy. The big question must always be, Where should I be putting my money right now? "To divine the future, look to the past." We've heard truisms like this one all our lives. Perhaps nowhere is it more apropos than when applied to the business cycle. The business cycle refers to the expansion and contraction of the economy. History shows a continual cycle of ups and downs. The business cycle model is sometimes shown as a circle because of its never-ending repetition: Like a perfect ring, you can start anywhere. (After all, which is the first car in a Ferris wheel?) However, the circle doesn't indicate how time passes, and therefore, most texts flip the bottom half to the right, as shown in Figure 1. This results in the familiar sine wave, showing the same repetition but along a horizontal axis denoting time. The average length of the cycle is four years. |
 FIGURE 1: THE IDEAL BUSINESS MODEL. Here you see the six stages: Early expansion, peak expansion, late expansion, early contraction, peak contraction, and late contraction. We can divide the cycle into six stages or phases: early expansion, peak expansion, late expansion, early contraction, peak contraction, and late contraction (leading into early expansion and so on). Identification of these stages and the resulting sector rotation leads to more profitable asset allocation. Remember, all markets are interrelated: What happens in one affects the others. A classic example is rising oil prices leading to lower transportation prices. It's difficult to find a starting position, as there is no one action that always results in the same reaction. One scenario could be an increasing demand for industrial commodities (copper, aluminum, lumber, gold) indicating a strengthening of the economy. This leads to fears of inflation and an increase in interest rates. This, in turn, leads to falling bond prices and the attendant rise in yields. This leads to falling stock prices. At some point, the economy may be increasing too rapidly and we may have more Fed tightening. This could lead to an inverse yield curve (short-term rates are higher than long-term ones). History has shown that this often leads to a slowing of the economy and the cycle reverses: Commodities fall, bonds rise, and stocks rise. Publications like Barron's, Value Line, Dow Theory Forecasts, and Investor's Business Daily (to name a few) track performance of upward of 100 industries. Value Line's "Timely stocks in timely industries" is a weekly monitor of industry rotation (and a good source of stock selection). These industries are divided into a hierarchy of groups referred to as sectors. These sectors are not cast in stone and may have different titles depending upon the institution doing the analysis. Typical sectors are:
Intermarket analysis sheds some light on why some sectors do well while others do not, followed at some later date by a switching of roles. To check on how well a sector is doing, you can compare it to one of the major indexes. Of course, this results in two indicators usually crossing each other and we sometimes forget which line should be doing what. A better way may be to create a ratio indicator. Divide the sector index by the major index. This results in a single indicator that is easier to interpret. If the trend is down, the sector is underperforming the market. If it is rising, then the sector is outperforming the market. |
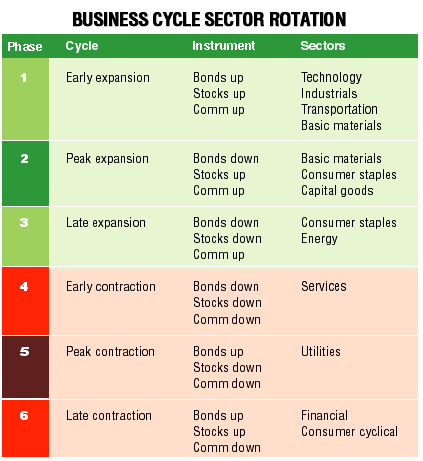
| SECTOR ROTATION Figure 2 presents the status of stocks, bonds, and commodities for each phase of the cycle and the sectors that are strong in each phase.
FIGURE 2: BUSINESS CYCLE SECTOR ROTATION. Here you see the status of stocks, bonds, and commodities for each phase of the cycle and the sectors that are strong in each phase. |
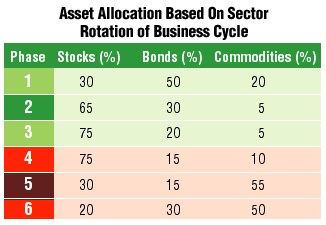
| Asset allocation models are continually appearing in financial literature. They are shown as pie charts with slices representing stocks, bonds, cash, and alternate investments, and they are usually classified by age group. Figure 3 shows an idealized allocation model for stocks, bonds, and commodities based upon the sector rotation of the business cycle as shown in Figure 2. As with all allocation models, the percentages represent a consensus of learned economists and financial planners, and should be tweaked.
FIGURE 3: ASSET ALLOCATION BASED ON SECTOR ROTATION OF BUSINESS CYCLE. While this model is idealized, it does give an idea of the sector rotation. Some repeating occurrences bear watching. Interest rate-sensitive stock groups generally lead the market. The direction of stocks and bonds generally leads the economy by three to six months. Trends in the commodity market alert us to the strength or weakness of the economy and the direction that inflation might take and, consequently, the direction of interest rates. Rising relative strength of energy and consumer staples usually signal a weakening economy (expansion is nearing an end). So to do the best you can with your limited resources, you must study, comprehend, and work hard to recognize the changes in the business cycle. With this, you can make intelligent decisions about the changes needed in your financial model. Rudy Teseo is a private stock, option, and currency trader, and has taught classes in option trading and the basics of stock charting. He can be reached at rftess@optonline.net. SUGGESTED READING Murphy, John J. [1991]. Intermarket Technical Analysis, John Wiley & Sons. _____ [1997]. The Visual Investor, John Wiley & Sons. Current and past articles from Working Money, The Investors' Magazine, can be found at Working-Money.com. |
Rudy Teseo is a private investor who trades stocks, options, and currencies. He has taught classes in technical analysis and option trading. He may be reached at rftess@optonline.net.
| E-mail address: | rftess@optonline.net |
PRINT THIS ARTICLE

Request Information From Our Sponsors
- StockCharts.com, Inc.
- Candle Patterns
- Candlestick Charting Explained
- Intermarket Technical Analysis
- John Murphy on Chart Analysis
- John Murphy's Chart Pattern Recognition
- John Murphy's Market Message
- MurphyExplainsMarketAnalysis-Intermarket Analysis
- MurphyExplainsMarketAnalysis-Visual Analysis
- StockCharts.com
- Technical Analysis of the Financial Markets
- The Visual Investor
- VectorVest, Inc.
- Executive Premier Workshop
- One-Day Options Course
- OptionsPro
- Retirement Income Workshop
- Sure-Fire Trading Systems (VectorVest, Inc.)
- Trading as a Business Workshop
- VectorVest 7 EOD
- VectorVest 7 RealTime/IntraDay
- VectorVest AutoTester
- VectorVest Educational Services
- VectorVest OnLine
- VectorVest Options Analyzer
- VectorVest ProGraphics v6.0
- VectorVest ProTrader 7
- VectorVest RealTime Derby Tool
- VectorVest Simulator
- VectorVest Variator
- VectorVest Watchdog


