HOT TOPICS LIST
- Strategies
- Stocks
- Buy
- Investing
- Brokers
- Psychology
- Interviews
- Accumulate
- Sell
- Hold
- Spotlight
- Websites
- Candlestick Corner
- Gold & Metals
- Options Trading
LIST OF TOPICS
CANDLESTICK CORNER
Bullish Engulfing Patterns: Powerful Buy Signals
07/11/06 02:45:52 PM PSTby Stephen W. Bigalow
Candlestick signals are merely the graphic depiction of investor sentiment during trend movements. Use them to your advantage.
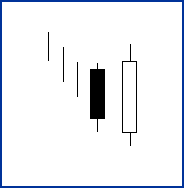
| Learning how to use candlestick signals has become easier in the past few years. Previously, the major concern was there were too many signals to learn and they didn't always work well. In recent years, those deterrents have been overcome, but investors still run into trouble when they are just beginning to study candlestick signals: Where do the signals occur in the trend? One facet makes candlestick signals highly accurate--the ability to identify a candlestick signal during a trend dramatically simplifies learning candlestick analysis. Candlestick analysis incorporates approximately 50 to 60 candlestick signals. Of these, you need learn only 12, which are considered the major ones. These signals produce most of the trend reversals. Recognizing the psychology that form these major signals will give you new insight into price movements. Understanding the investor psychology that form the major signals reveals optimal times to buy and sell. When candlestick analysis was being formed, Japanese rice traders realized that prices do not move based on fundamentals. Instead, they move based on the investor perception of those fundamentals. Candlestick signals are the visual depiction of investor sentiment. One of the most compelling candlestick signals is the bullish engulfing pattern. This signal is most effective when found in the oversold area at the end of a substantial downtrend. The pattern consists of two bodies; the first is the same color as the current trend, while the second is the opposite color. The signal day opens lower than the previous day's close, and then it trades higher. By the end of the day, the trading closes above the previous day's open. This new white candle now engulfs the previous day's candle known as the daki, or embracing line. A white bullish candle engulfing the previous black candle stands out like a neon sign after a series of black candles; it is clear that a change has occurred in investor sentiment. A couple of simple factors make the bullish engulfing pattern more convincing: The bigger the previous day's candle being engulfed, the more effective the new trend signal will be. Or the lower the open of the white candle, then coming back up to engulf the previous day, the more powerful the next advance should be.
|
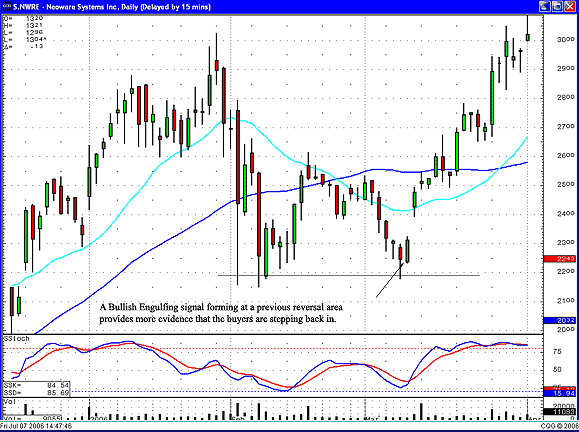
THE FORMULA (O-1>C-1) and The bullish engulfing pattern represents a change in investor sentiment. It reveals when the buyers have stepped in. In Figure 2, on the chart of Neoware, Inc. (NWRE), the market sentiment reversed at the bullish engulfing formations. The change of investor sentiment is stronger when it confirms with other technical indications. In this case, the bullish engulfing signal formed in an area that acted as a strong support level about a month ago.
|
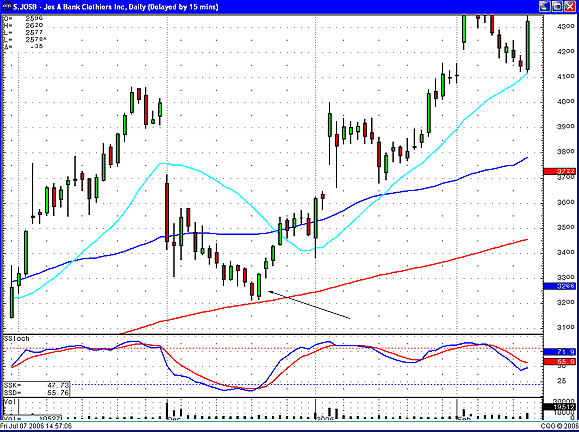
| GAPS A simple analysis of a candlestick signal is observing a gap up in price following the signal. The appearance of the signal not only reveals that investor sentiment has changed, but direction is changing with excessive force as well. The signals work equally well when analyzing indexes as they do for individual stocks, commodities, futures, or any other trading entity. Witnessing a bullish candlestick signal in an oversold condition, and at a major technical level, enhances the probability that a reversal has occurred. A major advantage produced by candlestick signals is that it reveals what investor sentiment is doing right now. Seeing a bullish signal at any major technical level allows the candlestick investor to react immediately. Whereas most technical indicators require confirmation that a trend has reversed, the candlestick signal immediately reveals investor sentiment at that level. Figure 3 illustrates in the Jos. A. Banks chart (JOSB) how the bullish engulfing signal is formed by gapping down exactly to the 200-day moving average. The buyers created a bullish engulfing signal that day. This became further evidence that a support level had been found and a reversal in investor sentiment had occurred.
|
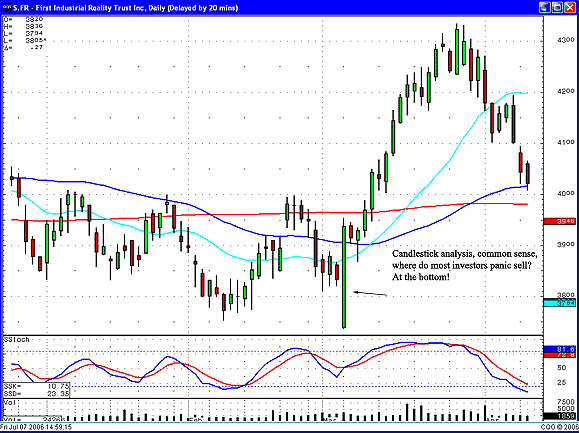
| BOTTOM REVERSALS The bullish engulfing pattern is statistically valid for indicating bottom reversals. As stated, the signals are highly accurate when a bullish engulfing pattern is witnessed during oversold conditions. The bigger the signal, the more convincing it becomes that a reversal has occurred. Analyzing what creates a bullish engulfing signal, with the prices opening lower and closing much higher, is a demonstration that investor sentiment has changed. The further down the price opens illustrates the panic selling at the bottom of a trend, then followed by obvious buying that produces simple evidence. A gap down in price shows that the sellers have capitulated. The buying illustrates this was the level the smart money was willing to start accumulating. Figure 4 shows the chart of First Industrial Realty Trust how the downtrend ended when the last of the sellers finally let their stock go. The large bullish engulfing signal clearly demonstrated that a change of investor sentiment had occurred. |
| TOP REVERSALS A big bullish engulfing pattern observed at the top of a trend usually represents a completely different story; it is usually the last gasp of the buying of the trend. If you keep this in mind, you will have another opportunity to extract profits out of a price trend. When the hopeful traders are buying once more at the top, you'll know what that last bullish engulfing pattern means. You should be prepared to take profits. The appearance of candlestick signals in the proper position of a trend will produce high-probability results. These results will be even better when candlesticks are combined with other technical indicators. Candlestick signals are merely the graphic depiction of investor sentiment during trend movements. Use them to your advantage. SUGGESTED READING Current and past articles from Working Money, The Investors' Magazine, can be found at Working-Money.com. |
Stephen W. Bigalow is an author and the principal of the www.candlestickforum.com, a website for providing information and educational material about candlestick investing.
| Website: | www.candlestickforum.com |
| E-mail address: | sbigalow@msn.com |
PRINT THIS ARTICLE

Request Information From Our Sponsors
- StockCharts.com, Inc.
- Candle Patterns
- Candlestick Charting Explained
- Intermarket Technical Analysis
- John Murphy on Chart Analysis
- John Murphy's Chart Pattern Recognition
- John Murphy's Market Message
- MurphyExplainsMarketAnalysis-Intermarket Analysis
- MurphyExplainsMarketAnalysis-Visual Analysis
- StockCharts.com
- Technical Analysis of the Financial Markets
- The Visual Investor
- VectorVest, Inc.
- Executive Premier Workshop
- One-Day Options Course
- OptionsPro
- Retirement Income Workshop
- Sure-Fire Trading Systems (VectorVest, Inc.)
- Trading as a Business Workshop
- VectorVest 7 EOD
- VectorVest 7 RealTime/IntraDay
- VectorVest AutoTester
- VectorVest Educational Services
- VectorVest OnLine
- VectorVest Options Analyzer
- VectorVest ProGraphics v6.0
- VectorVest ProTrader 7
- VectorVest RealTime Derby Tool
- VectorVest Simulator
- VectorVest Variator
- VectorVest Watchdog


