HOT TOPICS LIST
- Strategies
- Stocks
- Buy
- Investing
- Brokers
- Psychology
- Interviews
- Accumulate
- Sell
- Hold
- Spotlight
- Websites
- Candlestick Corner
- Gold & Metals
- Options Trading
LIST OF TOPICS
TRADER'S NOTEBOOK
Good Stop, Bad Stop: Chandelier Exits
07/27/06 12:40:45 PM PSTby Sharon Yamanaka
Using chandelier exits gives the trader the discipline to review his or her opportunities in trading a stock.Check and see.
Finding good stocks and creating screens are a joy to do. But those stops! All, and I mean all, of my losing trades are the ones that have hit my stops. That's how important they are. As John Sweeney, former editor of STOCKS & COMMODITIES, said in his book Campaign Trading:Just as it was tough when we were children to look under the bed or in a dark closet for night monsters, it's equally tough to look at a loss and acknowledge it. It was easier to hide under the covers back then and now it's easier to adopt some defense mechanism. (The one I hear most is "Oh, that trading rule doesn't work!" as if the entry strategy caused the loss.) After having been swept away once too often by deflating stocks, I've found that the easiest way to chase the monsters off is to never have to face them in the first place. And that means setting my stops before I place the trade. Of course, that was the advice I'd been getting from Day 1, Lesson 1 of Trading Stocks 101. But it's a long journey (into nightmares) from visualizing a hypothetical stop should the unthinkable happen, to acquiring the discipline and experience to place a hard stop on every trade I place. To quote Sweeney one more time, "Three things can happen to you [when you place a stop] and only one of them is good." That's because stops are tricky, and even though they're damage control, they can do more harm than good. I've been taken out of perfectly good trades by too tight a stop and ended up losing money on what should have been winning trades. Or taken out way too late from a losing position. Or hit a trailing stop that's 8% off from the high. If only... With that in mind, I've taken a look at chandelier exits. CHANDELIER EXITS
|
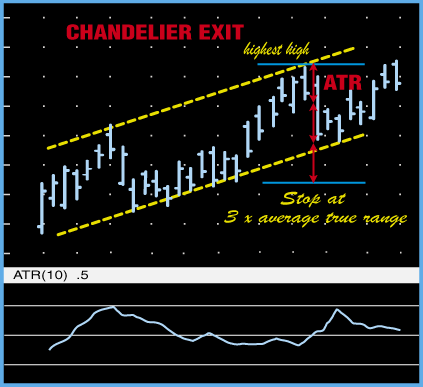
| This exit works by taking a multiple of the average true range (ATR): the range being the distance between the highest and lowest stock price for the day, average being the median price range for the past 10 days, and "true" including the closing price from the previous day as part of the following day's price range. The ATR then "hangs" from either the highest high or highest close of the past 21 days (Figure 1) to establish an exit, and thus the name. The chandelier stop's primary advantage is its responsiveness to market volatility, which eliminates some of the lag associated with other types of stops, particularly moving averages. Hanging it from the highest high--which often makes it look like a huge, sloppy exit point--actually keeps the stop from increasing. Theoretically, it should continue tightening as the stock tops out, volatility lessens, and ATR shrinks. To calculate the chandelier exit, start with average true range. You can find this value at Prophet.net (among other places) under their "Analyze" tab (www.prophet.net/analyze/sc.jsp). For a stop, ATR is usually multiplied by three to give an exit point. But that can be adjusted for risk tolerance, time frame, and trading style. The entry dictates the exit. If you entered a trade based on a chart pattern such as an ascending triangle, then your exit would be based on either the completion of the pattern or a stop-loss, should the pattern break down. So from the high point, keep adding in the ATR until it falls within the correct stop-loss range for your trade. |
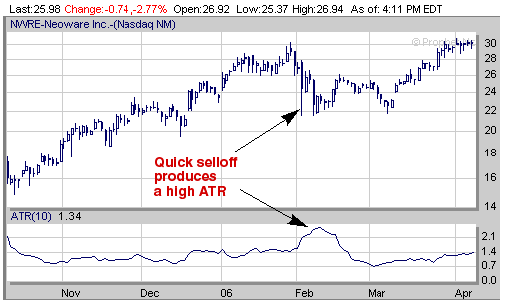
| AVERAGE TRUE RANGE ATR is a measurement of volatility, and tracking ATR itself is useful. A high number generally means the stock has bottomed, and a low ATR usually means that it is either consolidating or topping out. Developed by J. Welles Wilder, an early advocate of technical analysis, ATR is a variation of the average range, the latter being the highest and lowest price that a stock trades in a day. Wilder added the "true" to the range by using the previous day's close as the opening price. The previous day's close doesn't always affect the range, but when it does, it widens it, increasing the volatility. Wilder found this would take into account any after-hours activity on the part of the stock, often related to news events or company releases, thus giving a "truer" reflection of the stock's daily range. The chandelier exit offers a lot of variations--hanging the stop from lows rather than highs, changing the multiple of ATR, or increasing or decreasing the number of days used in calculating the average. The chandelier stop is so flexible that some versions allow you to use another measurement for volatility other than ATR, such as the daily range or average range. In addition, the exit can be recalculated daily, adjusting for slight changes in the moving average. In using this stop, you give yourself a unique exit point at a volatility-based distance from your entry, calculated to eliminate whipsaws, but not so low that you're exiting at everyone else's entry point or getting lost in the mass exodus at the breaking of a major support/resistance.
|
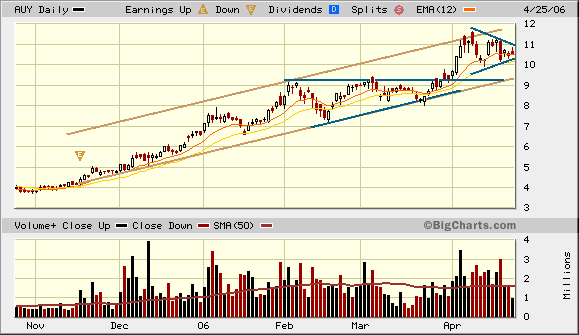
| EXAMPLE: THE ATR OF AUY Yamana Gold (AUY) is an example of a stock in a trending pattern. I categorize it as having high directionality and high volatility as defined in the March 2006 STOCKS & COMMODITIES article "Understanding Market Structure" by Paolo Pezzuti. As I write this (in mid-April) the market is in an uptrend, so it's easy to find stocks going up in a rising stock market. I'm looking to maximize my profits.
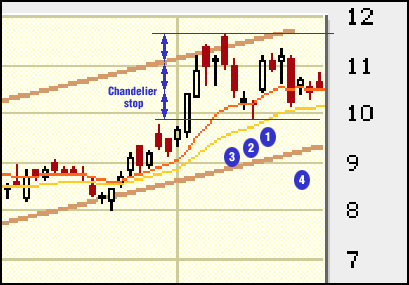
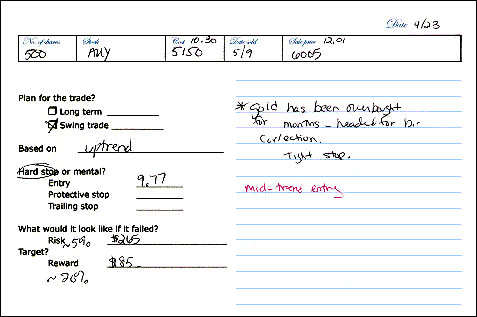
Rather than waiting for AUY to hit the bottom of its channel (Figure 3), I got into this stock on the pullback at 10.30. A nice symmetrical triangle had been forming as the stock consolidated, and gold futures had been rising after a retracement. I didn't think the stock would reach the lower trendline, but before I placed the order, I wanted to figure out a stop-loss. For a $10 stock, every 10-cent change in price is a 1% loss. By way of comparison, some of the different stops are: 1. 8% generic stop: 9.50 My objectives in buying the stock are for a short to intermediate time frame with a target of $12. AUY's trend channel is quite large, about 2.25, from the last low of 8 to the high of 11.5, which is more than 20% of the stock's value. So I'm looking to sell the stock at the top of the trend and wait for it to retreat and buy back in. By selling at the top, I'm also limiting my exposure come the inevitable fall in the price of gold. The stock could be shorted on the way down, but I'm not doing that right now. I could just hold onto the stock until it falls out of its upward trend, but I also want to maximize my profits. So I'm placing my stop at the shortest distance from my entry point, at the chandelier exit point of 9.77, slightly below 10, a support area for the stock. If I get stopped out, it'll be for a small loss and I can get back in at the bottom of the trend channel at 9.3 and save myself some money. My risk is no more than 5% for, roughly, a 20% gain.
This trade went my way and I hit my target of $12 and sold my position. After I sold AUY at the top of the channel in mid-May, I placed a limit order for at 8.50, well below the bottom of the channel, and got in a few days later (Figure 5). Even though the stock had fallen out of its channel, I'd been following gold and this particular stock for a while and wanted to get back in, expecting the stock would reenter its uptrend.
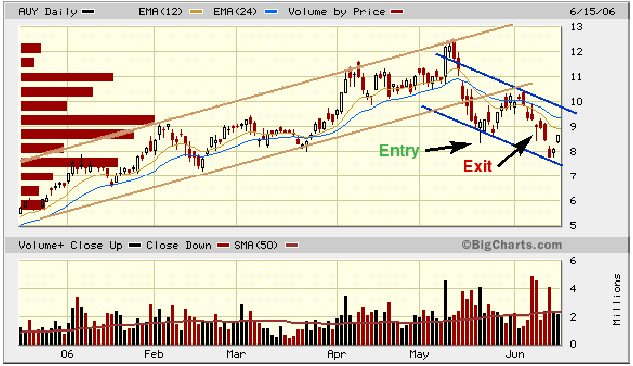
Once in, though, I found it harder to play the stock. The market indexes were uncertain, my stock was wobbling between chart patterns, and the futures price of gold that my stock reacted to like a high-strung thoroughbred at the starting gate may or may not have been topping or bottoming out. With all the uncertainty, I shouldn't have gotten back in, but 8.5 seemed like a very good price for AUY. In this position, a system like the chandelier exit gives me a discipline to follow when otherwise I would have no clear choice. As it happened, the stock immediately went up and I placed my chandelier stop at 8.72, higher than my entry point. With an ATR of 0.9, I needed to use four times the ATR to get a reasonable placement from the high of 12.42. I was eventually stopped out when the stock moved lower and seemed to be establishing a downtrend (Figure 4). No harm done. I missed out on profits, but I didn't lose anything in the trade either. |
CONCLUSION The shaft of the arrow had been feathered with one of the eagle's own plumes. We often give our enemies the means of our own destruction.--Aesop's Fables While I wouldn't actually go out and prove this, I believe that if you place your stops correctly, you can trade anything. I've found that if I spend more time monitoring my open trades rather than looking for new stocks to buy, my profits increase proportionally. In terms of trading psychology, using chandelier exits gives me the discipline to thoroughly review my options in trading a stock. The chandelier exit isn't a trading system in itself; rather, it is a flexible system that adapts itself to a specific trading style. I use chandelier exits as an entry stop-loss for trading chart patterns. Plus, I find ATR useful in itself as a measure of volatility. What's the only good stop to hit? Sometimes, a stock will blow past my target. Then I can tighten the trailing stop so that at the slightest correction, I'll be stopped out. I hate to sell a stock that's going up and normally I don't like being stopped out, but anything past that is icing on the cake. And who doesn't like the sweet stuff? Sharon Yamanaka may be reached at SYamanaka@Traders.com. SUGGESTED READING
Sidebar: Sidebar: |
| Title: | Staff Writer |
| Company: | Technical Analysis, Inc. |
| Address: | 4757 California AVE SW |
| Seattle, WA 98116 | |
| Phone # for sales: | 206 938 0570 |
| Fax: | 206 938 1307 |
| Website: | www.Working-Money.com |
| E-mail address: | syamanaka@traders.com |
Traders' Resource Links | |
| Charting the Stock Market: The Wyckoff Method -- Books | |
| Working-Money.com -- Online Trading Services | |
| Traders.com Advantage -- Online Trading Services | |
| Technical Analysis of Stocks & Commodities -- Publications and Newsletters | |
| Working Money, at Working-Money.com -- Publications and Newsletters | |
| Traders.com Advantage -- Publications and Newsletters | |
| Professional Traders Starter Kit -- Software | |
PRINT THIS ARTICLE

Request Information From Our Sponsors
- VectorVest, Inc.
- Executive Premier Workshop
- One-Day Options Course
- OptionsPro
- Retirement Income Workshop
- Sure-Fire Trading Systems (VectorVest, Inc.)
- Trading as a Business Workshop
- VectorVest 7 EOD
- VectorVest 7 RealTime/IntraDay
- VectorVest AutoTester
- VectorVest Educational Services
- VectorVest OnLine
- VectorVest Options Analyzer
- VectorVest ProGraphics v6.0
- VectorVest ProTrader 7
- VectorVest RealTime Derby Tool
- VectorVest Simulator
- VectorVest Variator
- VectorVest Watchdog
- StockCharts.com, Inc.
- Candle Patterns
- Candlestick Charting Explained
- Intermarket Technical Analysis
- John Murphy on Chart Analysis
- John Murphy's Chart Pattern Recognition
- John Murphy's Market Message
- MurphyExplainsMarketAnalysis-Intermarket Analysis
- MurphyExplainsMarketAnalysis-Visual Analysis
- StockCharts.com
- Technical Analysis of the Financial Markets
- The Visual Investor

