HOT TOPICS LIST
- Strategies
- Stocks
- Buy
- Investing
- Brokers
- Psychology
- Interviews
- Accumulate
- Sell
- Hold
- Spotlight
- Websites
- Candlestick Corner
- Gold & Metals
- Options Trading
LIST OF TOPICS
FOCUS ON
Accumulation and Distribution
08/15/06 04:32:00 PM PSTby David Penn
Here are the basics on buying and selling with the big boys.
| There are two things you want on your side when you are speculating or investing: the trend and the size—or volume. Trading with the trend (as in "the trend is your friend") is often described as trading "with the wind at your back." Think of a baseball park where the winds are blowing out from behind home plate. Pitches hit while the wind is coming from behind the batter tend to make the ball fly into the stands faster, higher, and more powerfully than pitches hit while the wind is in the batter's face. Something similar takes place when speculators place trades in strong trends. When the market is in a generally rising condition, for example, it is that much easier for good stocks and bad stocks to be buoyed by the sentiment that "stocks are good and going higher." Another relevant cliché is the one that says "a rising tide lifts all boats." Conversely, when the market is in a generally falling condition, it is often hard for even good stocks to get the necessary traction to move higher. A number of technical indicators and tools can help traders determine whether the market is in a trend and, if a trend is in effect, just how powerful it is. Some favor tools as simple and straightforward as moving averages and trendlines, while others are moved more by the vagaries of directional movement. However, the rule of thumb for trends remains the same: higher highs and higher lows define an uptrend, and lower highs and lower lows define a downtrend. It is amazing at how readily that formula can be used to make sense out of markets that often appear more complicated when looked at through more complex technical tools. A WORD FROM YOUR STOCK'S SPONSOR The company of other traders is certainly nice, but what traders especially long for is the interest of large institutions—mutual funds, hedge funds, and so on. These institutional buyers and sellers of stocks are prized for a number of reasons. First, they tend to buy in bulk, making their movements in the market clear to observe as they accumulate shares. Second, they tend to have as long or longer time frame than the average speculator (or even investor), meaning their "sponsorship" of a stock is likely to outlast a speculator's relatively short-term interest. Third, the arrival and departure of institutional interest in a stock is often in and of itself an excellent signal as to what stance the average retail buyer and seller of stocks should be taking with regard to that issue. Writing about institutional sponsorship of stock, William O'Neil of Investor's Business Daily noted in his book How To Make Money In Stocks: It takes big demand to move supply up, and the largest source of demand for stocks is by far the institutional buyer. A stock certainly does not need a large number of institutional owners, but it should have at least a few such sponsors. Three to ten might be a minimum or reasonable number of mutual fund sponsors, although some stocks might have a good deal more. Later, O'Neil gets close to the crux of the matter of why institutional support can be key for the retail speculator: If a stock has no professional sponsorship, chances are that its performance will be more run-of-the-mill. The odds are that at least several of the more than 1,000 institutional investors have looked at the stock and passed it over. Even if they are wrong, it still takes large buying to stimulate an important price increase in a security. For O'Neil, there is a sort of "not too hot/not too cold" approach that he believes is best for speculators when it comes to institutional sponsorship. His ideal situation is to buy a stock when it has a modest amount of institutional interest and to sell it after that institutional interest has peaked. He writes: A stock can also have too much sponsorship and become "overowned." Overowned is a term we coined and began using in 1969 to describe a stock whose institutional ownership had become excessive. In any case, excessive sponsorship can be adverse since it merely represents large potential selling if anything goes wrong in the company or the general market. ... The "favorite 50" and other lists of the most widely owned institutional stocks can be rather poor, and potentially risky, prospect lists. By the time performance is so obvious that almost all institutions own a stock, it is probably too late ... No surprise why O'Neil's chapter on institutional sponsorship is subtitled "A little goes a long way."
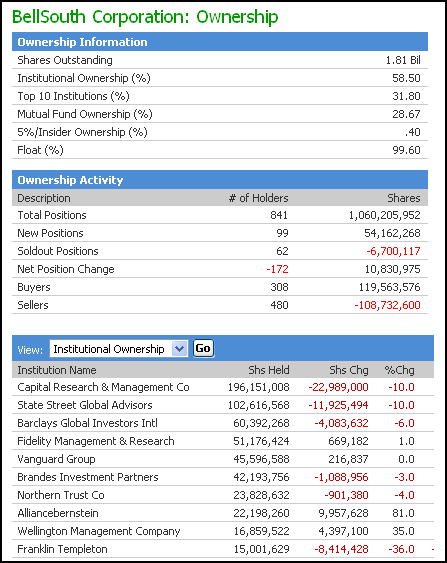
Speculators can get information on institutional sponsorship from a variety of sources. Online sources such as Yahoo! Finance provides information on major holders including insider transactions. And MSN Money provides an especially extensive report on institutional ownership, with information on mutual fund ownership (apart from other institutional ownership) and net position changes (including buyers and sellers), as well as the names and position sizes of those institutions that have taken up "sponsorship" of a given stock. |
| STAGE ANALYSIS The price charts themselves, however, can provide keys to the behavior of large institutions in the stock market. Large institutions are like ocean liners that leave a large wake even in the deepest waters and broadest seas. There are two ways of looking for the tracks of institutional involvement in a stock, ways that don't require complex technical indicators or difficult-to-configure technical tools. The first is sort of stage analysis of the kind promoted by technicians like Stan Weinstein in his book, Secrets For Profiting In Bull And Bear Markets, and Richard Wyckoff as described in the book edited by Jack Hutson, the Technical Analysis of STOCKS & COMMODITIES magazine publisher, called Charting The Stock Market. The second is a more direct method that, while applicable to stage analysis and incorporated to one degree or another in virtually all volume-oriented technical indicators, is to volume analysis what "higher highs and higher lows/lower highs and lower lows" is to trend analysis. Stage analysis looks at the rise and fall of a stock or a market as a series of specific steps. Weinstein is especially articulate on this topic. His "stage chart" posits four distinct stages that every rising stock or market must pass through. "Stage 1" is referred to as "the basing area," and Weinstein describes how a stock gets to this place—and what this place means—thusly: After stock XYZ has been declining for several months, it eventually will lose downside momentum and start to trend sideways. What's actually taking place is that buyers and sellers are starting to move into equilibrium, whereas previously the sellers were far stronger, which is why the stock has plummeted. Volume will usually lessen—dry up—as a base forms. But often volume will start to expand late in Stage 1, even though prices remain little unchanged. This is an indication that dumping of the stock by disgruntled owners is no longer driving down the price. The buyers who are moving in to take the stock off their hands are not demanding any significant price concession. This is a favorable indication. Such "basing areas" are fertile ground for accumulation for all the reasons Weinstein states. The selling pressure has abated. The stock in price terms has become cheap. And the lack of significant movement has likely reduced interest in the stock on the part of buyers, making it easier for large institutions to begin buying shares without attracting too much attention.
I should point out that in "basing areas," there is also some distribution going on. This is because it can sometimes be difficult to tell the difference between a basing area and a consolidation—even a longer-term consolidation—in a trend. Those who are distributing in a "basing area," however, are the market "dead-enders" who have held onto their shares and are only now finally selling them in disgust. They represent the fabled "dumb money" that tends to sell at the lows and buy at the highs. After a stock moves from the basing area, it enters what Weinstein calls "the advancing phase"—which is pretty much self-explanatory. The "advancing phase" leads eventually to what he calls "the top area," which might also be called the distribution zone. It is here where "smart money," having accumulated shares during the "basing area" and early in the "advancing phase," is now taking profits. As Weinstein writes: Volume is usually heavy in Stage 3 and the moves are sharp and choppy. If you've ever heard the expression that a stock is "churning" (moving sideways on heavy volume), this stage is an outstanding example of it. The heavy volume on the part of the buyers, who are excited by the improving fundamentals or "story," is met in equal measure by aggressive selling by the people who bought at considerably lower prices and are heading for the exits. Stage 3 ("the top area") and early stage 4 ("the declining phase") are when the institutions begin distributing their shares—accumulated at lower prices—to those who are either late to the party or greedy for even greater gains. As with the "basing stage," there is a wrong-way crowd here as well, a group of traders, speculators, and investors who are accumulating shares at exactly the moment they should be distributing shares (or waiting on the sidelines if they aren't already in the market). While it is true that distribution also occurs during the "declining phase," two things are worth pointing out. One, it is the loss of institutional support (or, at least, the ebbing of such sponsorship) that often leads to the declines that come in stage 4. Tremendous volume spikes during which institutions unload their sizable positions onto the market, as I'll make much of later, often characterize this loss of support. And when such volume spikes occur during days when the market opens up and closes down, they are often excellent warning signs that serious distribution is taking place. Two, by the time that selling is under way deep in Weinstein's "declining phase" of stage 4, most institutions have either (a) unloaded most of the shares they plan to unload or (b) waiting for bounces into which they can resume selling—the proverbial "selling into strength." Most of the selling during the "declining phase"--outside of the few last purgings from institutions—is from smaller and smaller investors, speculators, and traders who are less reluctant to part with shares often purchased at prices close to those in the "top area." This is one of the reasons why it is a market axiom that markets bottom quietly on low volume. Those with lots of stock to sell tend to be those institutions with managers smart enough to begin distribution, selling much of their holdings long before the market for those stocks begins to give way. |
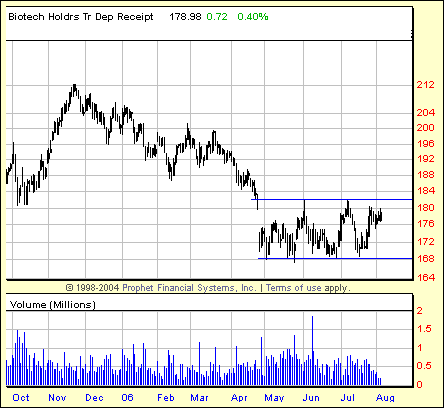
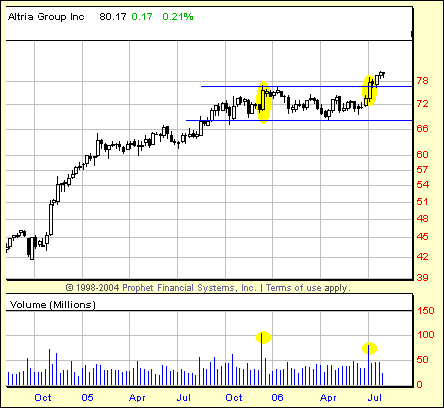
| SPIKE THE VOLUME I mentioned volume spikes previously. For me, when presented with a price and volume chart unadorned with the latest technical indicator, nothing will attract my attention quicker than a huge surge in volume, a spike that towers over all the other volume bars in the vicinity (and most that aren't in the vicinity as well). Often, this surge in volume is associated with a stock or market that is breaking free from a consolidation with upside breaks referred to as "breakouts" and downside breaks referred to as "breakdowns." And often, these volume spikes in and of themselves will serve as magnets for traders who see in the sudden and dramatic increase in participation during a given session as evidence that the stock or market in question will continue to move in the direction suggested by the session (big volume on a close higher? Time to buy. Big volume on a close lower? Time to sell). For the purposes of this conversation, I should point out that big volume on sessions that closer higher are typically evidence of accumulation, while big volume on sessions that closer lower are typically evidence of distribution. One quick way to gauge whether a market is being accumulated or distributed is to look at the big volume sessions (and by "big," I'm referring to two to three times average session volume at a minimum) over a certain period and determine whether the big volume days were accumulative or distributive. Writing in his book Technical Analysis: Plain And Simple, author Michael Kahn comments on the notion of accumulation and distribution: Accumulation and distribution show up in the volume portion of the charts. Often, there is a pickup in volume before patterns break or trends reverse, and this leads to the old adage "Volume precedes price." If an investor can pick up these often-subtle changes, then he or she can be well positioned to take advantage of what is to come ...
Other research appears to back Kahn's second assertion that volume and price must be seen together in this kind of analysis. Big volume alone that is not accompanied by a significant move in price is not at all indicative of a powerful, directional move in the sessions afterward. Writing in their book How Markets Really Work, authors Larry Connors and Conor Sen observe the following: Large Volume Days Alone Are Insignificant ... If you look at the average daily gain of the SPX and the NDX on the day that has the highest volume in a week, you'll see very mixed results. The 1-day SPX return was better than the average daily return but the 1-day NDX return was well under the average. The 1-week SPX return was near the average return and the monthly return outperformed. Their conclusion? "Mixed results here and certainly no clear evidence of any edge looking only at days with big volume." This, of course, does not mean that "days with big volume" cannot be the starting point for further analysis. I'd argue—and Connors and Sen's research seems to support it—that "days with big volume" are a reasonable screen to start with—with a caveat added to make the screen truly effective. There was one place where we did find an edge and it's a healthy one: When prices had their biggest up day over the past 10 days and their biggest volume day the same day, the returns over the next day were on average up .25%. For the next week they were up .60% and for the next month they were 1.45%. These results tell us that a short-term edge seems to exist when you isolate a large up move that coincides with healthy volume. Given this, one task for the speculator looking for instances of accumulation for potential long opportunities and instances of distribution for potential short opportunities seems clear: look for the volume spike in a session with larger than average range. If that range is resolved with a higher close, then the likelihood is that accumulation is taking place. If that range is resolved with a lower close, then the likelihood is that distribution is taking place. Combining this notion with what has already been discussed with regard to stage analysis and the role of large institutions, and speculators can consider themselves armed with a basic, yet effective and straightforward way of finding tradable opportunities on the long and short sides. |
| SUGGESTED READING Connors, Larry, and Conor Sen [2004]. How Markets Really Work, Trading Markets Publishing Group. Kahn, Michael [2006]. Technical Analysis: Plain And Simple, Financial Times/Prentice Hall. O'Neil, William J. [1995]. How To Make Money In Stocks, 2nd ed., McGraw Hill. Weinstein, Stan [1988]. Secrets For Profiting In Bull And Bear Markets, Dow Jones-Irwin. |
Technical Writer for Technical Analysis of STOCKS & COMMODITIES magazine, Working-Money.com, and Traders.com Advantage.
| Title: | Traders.com Technical Writer |
| Company: | Technical Analysis, Inc. |
| Address: | 4757 California Avenue SW |
| Seattle, WA 98116 | |
| Phone # for sales: | 206 938 0570 |
| Fax: | 206 938 1307 |
| Website: | www.traders.com |
| E-mail address: | DPenn@traders.com |
Traders' Resource Links | |
| Charting the Stock Market: The Wyckoff Method -- Books | |
| Working-Money.com -- Online Trading Services | |
| Traders.com Advantage -- Online Trading Services | |
| Technical Analysis of Stocks & Commodities -- Publications and Newsletters | |
| Working Money, at Working-Money.com -- Publications and Newsletters | |
| Traders.com Advantage -- Publications and Newsletters | |
| Professional Traders Starter Kit -- Software | |
PRINT THIS ARTICLE

|

Request Information From Our Sponsors
- StockCharts.com, Inc.
- Candle Patterns
- Candlestick Charting Explained
- Intermarket Technical Analysis
- John Murphy on Chart Analysis
- John Murphy's Chart Pattern Recognition
- John Murphy's Market Message
- MurphyExplainsMarketAnalysis-Intermarket Analysis
- MurphyExplainsMarketAnalysis-Visual Analysis
- StockCharts.com
- Technical Analysis of the Financial Markets
- The Visual Investor
- VectorVest, Inc.
- Executive Premier Workshop
- One-Day Options Course
- OptionsPro
- Retirement Income Workshop
- Sure-Fire Trading Systems (VectorVest, Inc.)
- Trading as a Business Workshop
- VectorVest 7 EOD
- VectorVest 7 RealTime/IntraDay
- VectorVest AutoTester
- VectorVest Educational Services
- VectorVest OnLine
- VectorVest Options Analyzer
- VectorVest ProGraphics v6.0
- VectorVest ProTrader 7
- VectorVest RealTime Derby Tool
- VectorVest Simulator
- VectorVest Variator
- VectorVest Watchdog


