HOT TOPICS LIST
- Strategies
- Stocks
- Buy
- Investing
- Brokers
- Psychology
- Interviews
- Accumulate
- Sell
- Hold
- Spotlight
- Websites
- Candlestick Corner
- Gold & Metals
- Options Trading
LIST OF TOPICS
TRADER'S NOTEBOOK
The Anatomy Of The 10-Bagger
09/05/06 05:41:26 PM PSTby Thomas Maskell
Shh! We're hunting for these elusive (but not particularly rare) stocks.
| So far in our search for the 10-bagger, we have identified 588 stocks that doubled in price during the past 52 weeks (see part 1, in Working Money back in March 2006). A 10-bagger is a stock that increases in price 10-fold in three years or fewer. To do that, it must at least double in price in each of those three years--a requirement that is easily spotted using an online stock screen, such as the screen available at www.reuters.com. Screening for these doublers, 588 in all, pointed the way to our 10-baggers. NARROWING THE LIST Using a stock charting service like bigcharts.com will allow us to quickly observe these 254 stocks and identify the 10-baggers. Of course, identifying a 10-bagger by chart requires a set of its own criteria. The criteria are launch point, move duration, and peak price. The launch point is the date that the stock closes above its six-month simple moving average (SMA). Its move duration is the time it takes to move from launch to its peak price. Its peak price is the highest open or close price achieved during the move. For ease of observation, I based this discussion on a five-year monthly chart. Daily and weekly charts will help you fine-tune the analysis, but they lose a lot of instructional value on reproduction. Using monthly charts and the criteria given, 44 of the 254 stocks were identified as 10-baggers.
|
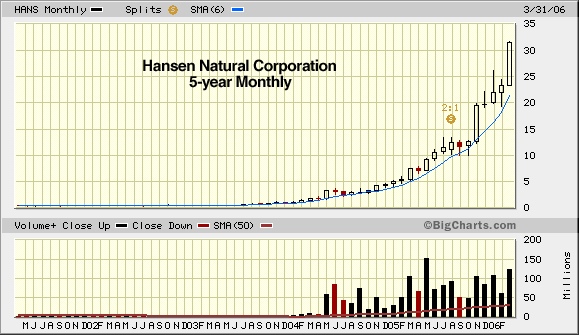
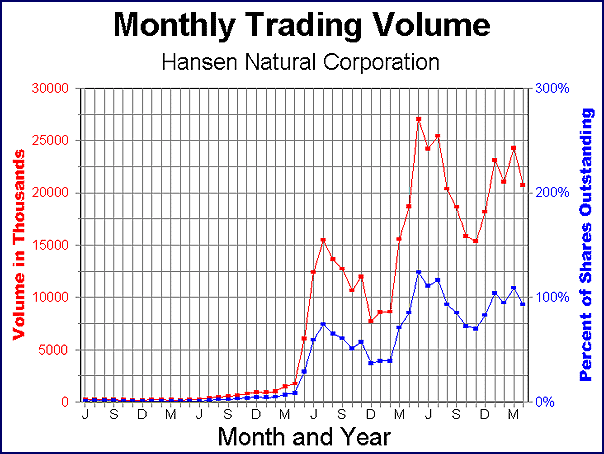
| THE 10-BAGGERS Figure 1 is a screen capture that illustrates an ideal 10-bagger. I say ideal because many 10-baggers are not this perfect. Of the 44 10-baggers gleaned from our list of 254 potentials, 35 fit this ideal. What is the ideal? It is a stock that closes above its six-month simple moving average (SMA) and does not close more than 10% below SMA during its 10-fold rise. In Figure 1, Hansen Natural Corp. (HANS) began its move in July 2003 when it closed above its six-month SMA at $2.55. Over the next 33 months, it never fell more than 10% below SMA as it climbed to a peak price of $148.20—a 58-bagger. It was a 10-bagger within 20 months (March 2005). In addition, during the stock's rise, its monthly trading volume increased. This is hard to see in Figure 1, so I have replotted it in Figure 2 as both an absolute number and as a percent of the total shares outstanding. Prior to launch, the three-month moving average (MA) in Figure 2 hovered around 250,000 shares. In the launch month, 647,000 shares were traded, more than double the MA. Within seven months of launch, the MA was more than one million shares; and within a year, it was more than 12 million shares. The stock volume began to subside in August 2004, and then increased again in March 2005, the month it achieved 10-bagger status. From there, it went on to higher prices and greater volumes.
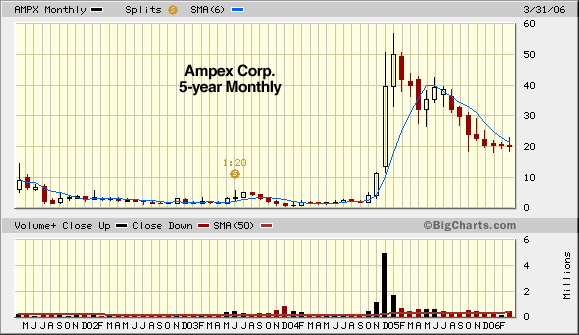
Two other interesting points should be noted about this volume. The first, as seen in Figure 2, is the percent of shares outstanding (SO) that was traded on average each month. It rose above 100% in May, June, and July 2005. (The monthly volume reached that level in June 2004.) The concept of a company trading more than 100% of its shares outstanding in one month is intriguing. The second point and equally intriguing is the number of shareholders in HANS, not shown in Figure 2. From the point of launch to the peak price, the number of shareholders in HANS was reported to have declined from 619 million to 514 million. More shares were traded by fewer shareholders. This would suggest an institutional rather than a general market binge. If this holds true for most 10-baggers, it could be a useful bit of information. Let's move from the ideal to the sublime. Figure 3 presents the stock chart of Ampex Corp. (AMPX). AMPX is not on our list of 44, but it is a mouth-watering chart that illustrates a compressed 10-bagger. Technically, AMPX launched in February 2004 after two false starts (November 2002 and May 2003). Its launch price (at close) was $1.75, but it achieved that price on a monthly volume of only 320,000, half of the preceding MA. After launch, its price managed to just track its SMA for the next seven months on decreased volume. Given that its two failed breakouts were volumes that were two and four times greater than the MA, ignoring this launch would have been a prudent course of action. This brings us to October 2004.
In October 2004, AMPX's price moved from $1.85 to $4.09 on a volume of 397,000, three times the preceding MA. That was followed with a close of $11.40 on volume of 1,116,000 in November, a close of $39.50 on 4,933,000 in December, and a close of $50.04 on 1,664,000 in January 2005. In four months it moved from $1.85 to $50.04, a 27-bagger. Three months after its peak price, it closed at $32. After a modest uptick, it continued to slide, closing at $17.45 on May 6, 2006—a decline of 65% from its peak price, but still a 10-bagger from its February 2004 launch price of $1.75. Figure 3 illustrates how difficult it is to establish rules. If you bought the launch in November 2002 and used 10% below the SMA as a sellpoint, you would have sold the stock the next month at a 50% loss. Your next entry point would be May 2003 with a sale in October for another 30% loss. You could enter again in February 2004 (assuming you weren't too battle-fatigued to continue), with a sale in August 2005 for a gain of 1,700% (finally!). If you started with $10,000, you would have ended up with $64,000, a six-bagger—not a bad return over 34 months. If you ignored the February entry and waited until October, you would have ended up with $27,384, still not bad. A 27-bagger can compensate for a lot of flaws in an investment plan. If AMPX was just a 10-bagger, selling on a 10% correction would have resulted in a loss of about $150. So any rules we use to guide our stock decisions would have to be statistically significant. Statistics are the study of populations and behaviors. Any quantifiable population or behavior can be analyzed using statistics. In business, statistics are used to improve decision-making. A businessman strives for an 85% confidence level; he wants 85% of his decisions to be correct. While he may strive for 85%, it has been reported that most successful managers are correct only 70% of the time. If we could create rules with a 70% to 85% confidence level, we would have a very powerful stock market strategy. |
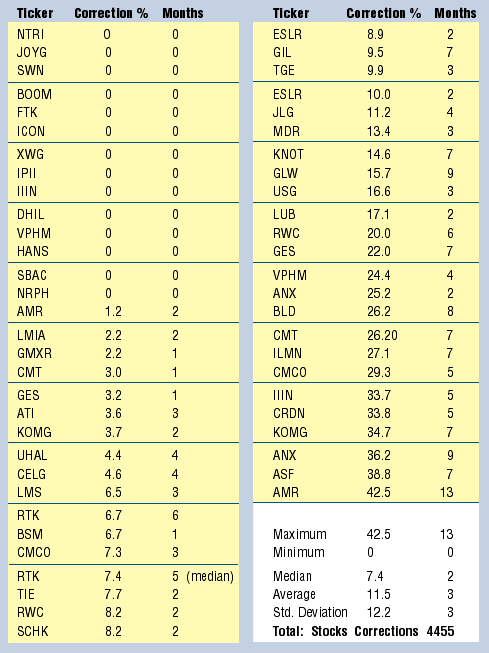
 FIGURE 4: PRICE CORRECTIONS OF TEN BAGGERS. Here you see how many of the stocks corrected and by how much. The statistics provided here give you some idea of the basic chart patterns of the listed stocks. In Figure 4, the 44 10-baggers are listed. Also listed are their price corrections in comparison to their six-month SMA. Eleven of the 44 stocks corrected twice while 14 did not correct (according to our definition). Two stocks are listed as having corrected and not corrected. These are stocks that had a correction after achieving 10-bag status but then went on to new highs. I included that second correction, but you may choose to ignore it. At the bottom are a few simple statistics, which will help us establish some rules. I recognize that these are very basic, but even the basics can be useful. The data presented is sorted by "Correction %." Half the stocks corrected 7.4% or less during their advance. Twenty-seven (61%) of them corrected 10% or less. The 10% (or less) limit also represents 35 of the 55 corrections (64%). Thirty-three of the stocks did not correct or corrected only once (75%). Eleven corrected twice. There were as many corrections greater than 20% (14) as there were corrections at zero percent. Just based on these statistics, it is difficult to establish a significant sell strategy. Certainly, if we are to achieve a 70% confidence level, we will need more information. THE REWARDS Since there are three kinds of players in the stock market, we will approach this study from three different perspectives. First, we will approach it as investors and study the underlying fundamentals. Second, we will become traders and look for clues in the charts. Finally, as speculators, we will go beyond the fundamentals and the indicators; we will anticipate price based on events, trends, and innovations. Somewhere, in that mix of market strategies and historical data, we hope to find the key to unlocking the rewards of the 10-bagger. |
| SUGGESTED READING Maskell, Thomas [2006]. "The Search For The 10-Bagger Begins," Working-Money.com, March 23. |
Thomas Maskell is a frequent S&C contributor whose recent book, The Complete Guide to Investing During Retirement, provides an excellent primer on investing, trading and speculation in the stock market. It is available nationwide. To comment on this article or his book, contact him at Retireestocks@aol.com or visit his blog at retireestocks.blogspot.com.
| E-mail address: | Retireestocks@aol.com |
PRINT THIS ARTICLE

Request Information From Our Sponsors
- StockCharts.com, Inc.
- Candle Patterns
- Candlestick Charting Explained
- Intermarket Technical Analysis
- John Murphy on Chart Analysis
- John Murphy's Chart Pattern Recognition
- John Murphy's Market Message
- MurphyExplainsMarketAnalysis-Intermarket Analysis
- MurphyExplainsMarketAnalysis-Visual Analysis
- StockCharts.com
- Technical Analysis of the Financial Markets
- The Visual Investor
- VectorVest, Inc.
- Executive Premier Workshop
- One-Day Options Course
- OptionsPro
- Retirement Income Workshop
- Sure-Fire Trading Systems (VectorVest, Inc.)
- Trading as a Business Workshop
- VectorVest 7 EOD
- VectorVest 7 RealTime/IntraDay
- VectorVest AutoTester
- VectorVest Educational Services
- VectorVest OnLine
- VectorVest Options Analyzer
- VectorVest ProGraphics v6.0
- VectorVest ProTrader 7
- VectorVest RealTime Derby Tool
- VectorVest Simulator
- VectorVest Variator
- VectorVest Watchdog


