HOT TOPICS LIST
- Strategies
- Stocks
- Buy
- Investing
- Brokers
- Psychology
- Interviews
- Accumulate
- Sell
- Hold
- Spotlight
- Websites
- Candlestick Corner
- Gold & Metals
- Options Trading
LIST OF TOPICS
FOCUS ON
What's In A Trend?
09/12/06 02:54:26 PM PSTby David Penn
Trendlines, moving averages, and directional movement: three ways of knowing which way is up--or down.
| The trend is your friend, until the end, when it bends. Sounds easy enough. But if the trend is your friend, and if everybody knows that trading with the trend is the smartest way to participate in the markets, why aren't we all rich? Sometimes, it's easy to miss the forest of the underlying trend for the trees of news reports, government announcements, new technical indicators, corporate earnings reports, analyst chatter, and the endless "Is this a bull market or a bear market?" debate. This is one of the reasons I made a midyear resolution to always look at a chart of a market first without indicators—just price and volume—and to only bring in other technical tools if it looks as if there is something promising in price and volume. Does that mean I will miss opportunities? Probably. But it also means that the opportunities I spend time studying are that much more likely to yield profitable results. I'm no rocket scientist, and if it takes rocket science to be able to tell whether a market is worth buying or selling, then it is a market I don't need to be worrying about right now. As Oliver Velez, founder of Pristine.com, once pointed out in a seminar, the main edge that the average retail trader has over hedge funds and institutional traders when it comes to the markets is that the average retail trader doesn't have to trade. As an average retail trader, we have the advantage of only having to swing at the best pitches. Unlike the big-money professionals, retail traders can and should use as much patience at the plate as necessary. And that includes the ultimate patience of walking away and playing another day. HIGHER HIGHS AND LOWER LOWS Pick any spot on the chart and ask yourself: From this point forward, is this market making higher highs and higher lows? Or lower highs and lower lows? While there is more to price and volume than this, figuring out whether a market is making higher highs and higher lows or vice versa is more than half of the analytic battle. Again, if is difficult to tell whether a market is making higher highs and higher lows or vice versa, then move onto the next market. Sure, this discriminating attitude might feel difficult in trading foreign exchange with its relatively fewer trading options compared to stocks. But the edge of the average retail trader isn't in the ability to analyze a market into submission, forcing it to confess its true, underlying trend. The edge of the average retail trader is in playing or not. If a market wants to keep its trend a secret by bobbing and weaving all over the place, then let it and move on to something else. If you think you've got a market, put your observation to the test with a trendline. Now, there are different ways to draw trendlines, and some of them have some interesting applications. John Bollinger, who developed Bollinger Bands, a popular technical indicator, has spoken about drawing uptrend lines above prices as resistance rather than below them as support. Coming from Bollinger, this shouldn't be too surprising, insofar as his Bollinger Bands serve the same purpose as an uptrend line that is above prices and a downtrend line that is below them. The idea behind this approach is to capture the action when a market moves from its standard trend to a more exceptional (or extreme) trend. Whether you want to take a pro-exceptional stand—buying above the resistance/uptrend line or selling below the support/downtrend line—or fade it, this is one sound approach to trendlines that traders should consider from time to time. |
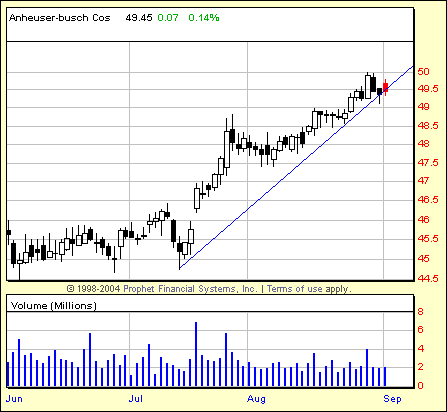
 FIGURE 1: ANHEUSER-BUSCH, DAILY. Connecting the lowest low to the highest low immediately preceding the highest high shows this market testing its uptrend line for support. However, as far as I'm concerned, the gold standard for drawing trendlines was provided by Victor Sperandeo in his book Trader Vic: Methods Of A Wall Street Master. In that excellent work, Sperandeo illustrates a method for drawing trendlines that is simple and consistent. As such, any rule you adopt to trade based on trendlines will also be consistent and applicable to whatever markets you trade. Sperandeo describes his method for drawing trendlines thusly: For an uptrend within the period of consideration, draw a line from the lowest low, up and to the highest minor low preceding the highest high so that the line does not pass through prices in between the two low points. Extend the line upwards past the highest high point ... For a downtrend within the period of consideration, draw a line from the highest high point to the lowest minor high point preceding the lowest low so that the line does not pass through prices in between the two high points. Extend the line past the lowest high point downward. This is far and away the best description of drawing trendlines I have come across. As Sperandeo writes, it has the benefit of being both accurate and consistent, keeping traders from, as he says, " drawing a trendline to suit (their) purposes ... from imposing your wish onto the trendline." MOVING AVERAGES MARK TRENDS Few tools do this better than moving averages. Arguably, if 100 traders were told at gunpoint that there was only one technical indicator they were allowed to use, I wouldn't be surprised if moving averages were among the top selections. Moving averages bring back some of the nuance that trendlines tend to treat as less relevant. This is because where a trendline is based on the relationship between a few key points in a trend (that is, trendline "touches"), moving averages take into account every single closing price in the market to help traders determine whether a trend is in place (a moving average that moves upward or downward, rather than remaining more or less flat). John Murphy, in his book The Visual Investor, notes: It may be helpful to think of a moving average as a curving trendline. A moving average can serve the same purpose as a trendline in the sense that it provides support during selloffs in an uptrend and resistance to bounces in a downtrend. The breaking of the moving average line usually carries the same meaning as the breaking of a trendline in the sense that it implies a trend change. The main advantage of the moving average over the trendline is the former's ability to combine more than one moving average line to generate additional trading signals. Murphy also points out that moving averages, "as helpful as they are, are lagging indicators. They confirm that a trend change has occurred, but only after the fact." I would argue that this lagging issue is more a quality of any trend-tracking tool, trendlines, or moving averages. Again, when you consider what a trend is—a series of higher highs and higher lows or a series of lower highs and lower lows—then it becomes clearer why it could only be this way. It is difficult—if not impossible—to anticipate whether either pattern will continue until it pretty much proves it won't be either making a lower high in the case of an uptrend or a higher low in the case of a downtrend. Until a trend does one of those two things, there really isn't any verifiable way of determining that the trend has in fact changed. There are tools that do a better job of guessing than others—and one of those will be the topic of the third and last section of this discussion. But for now, suffice to say that if your intention is to trade with the trend rather than pick tops, bottoms and reversals, then this lagging criticism can be a bit overstated. |
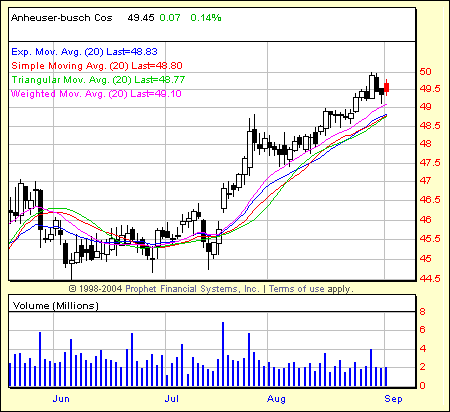
 FIGURE 2: ANHEUSER-BUSCH, DAILY. The variations in moving averages between exponential, simple, triangular, and weighted of the same duration are subtle in application, but they do exist. That said, there are a number of ways traders have attempted to deal with the various drawbacks of moving averages. By using exponential moving averages (EMAs), for example, instead of simple moving averages, traders can put greater emphasis on more recent prices. In a simple, 20-day moving average, the closing price on the 19th day is as significant as yesterday's closing price in determining the curve of the moving average. An EMA, on the other hand, puts greater mathematical weight on prices as they occur. This is an attempt to imprint the most recent market movement onto the shape of the moving average and reduce the lag. Other, more esoteric moving averages include the triangular moving average, which emphasizes the middle section in the indicator's duration, the variable moving average that uses volatility as its main influence on the price series, and the weighted moving average, which is similar to the EMA in putting greater emphasis on more recent prices. THE BIG (DIRECTIONAL) MO Directional movement is the most fascinating concept I have studied. Defining it is a little like chasing the end of a rainbow ... I have probably spent more time studying directional movement than any other concept. There's your endorsement. Here's what directional movement, per Welles Wilder, can do for you: Think of the implications of being able to rate the directional movement of any or all commodities or stocks on a scale of zero to one hundred. If you use a trend-following method, you would trade only those commodities that are in the upper end of the scale. If you are using a system that capitalizes on choppy or non-trending markets, then you would trade only those commodities at the lower end of the scale. Directional movement is described as both negative (-DI) and positive (+DI). When negative directional movement exceeds positive directional movement, a bearish outlook is appropriate. When positive directional movement exceeds negative directional movement, buying tends to be in order. What the ADX does is measure and smooth out the differences between negative and positive directional movement. When the difference between the two types of directional movement is growing—bears increasingly overtaking bulls or bulls increasingly overtaking bears—then there is the likelihood that a trend is developing and the ADX will increase in value. Conversely, when the difference between negative and positive directional movement is growing smaller, the ADX will decrease in value, reflecting a relative parity between bullish and bearish forces. |
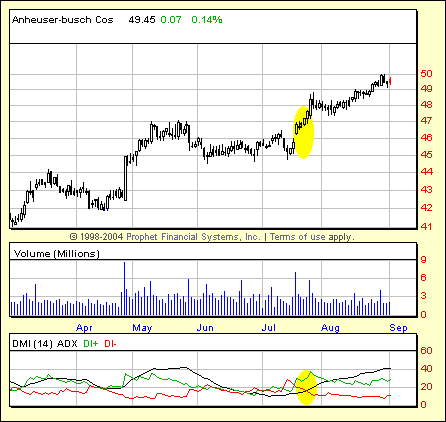
 FIGURE 3: ANHEUSER-BUSCH, DAILY. The ADX (in black) dips below 20 to reflect the trendlessness of the June-July period, then rallies as the stock begins to break out in late July and into August. There are a number of ways to use ADX. Price Headley, in his book Big Trends In Trading, takes the following approach: What I look for is ADX coming off a low level, preferably under 20, and then not only turning up, but also crossing above the lower DM line to suggest a forceful trend is developing. The key here is that ADX is a mean reverting indicator at the extremes. If you buy a stock whose ADX is already over 50, that says the trend has already been in force for quite a while and could be an extra risk of reversing. Another way of using directional movement is to take the ADX and create a moving average of it (often called the ADXR). According to Elli Gifford in The Investor's Guide To Technical Analysis, "It is the ADXR which gives the main signals; when it is above the 20-25 area it is said to denote a trending market and when it is below 20 the market can be considered to be trendless." TRUST IN TRENDS In spite of all the effort that goes into trying to understand the market through ever more esoteric filters, the game of buying low and selling high, or buying high and selling higher, hasn't changed in hundreds of years. Find a market that is moving in a given direction, enjoin that market when it is cheap relative to its recent movement in that same direction, and limit your losses when it becomes clear that the direction has changed. And if the technical tools you use don't make it easier for you to do those things, then it may be time to reconsider those technical tools. Sir Isaac Newton's first law of motion "that an object at rest tends to remain at rest and an object in motion tends to remain in motion" has some relevance to the world of trends. As Michael Kahn writes in his book, Technical Analysis: Plain And Simple, "The old adage says, %91The trend is your friend.' Why? It is because trends tend to perpetuate unless something causes them to do otherwise." When veteran traders and wise guys insist that traders be wary of the bad trades because the good trades will take care of themselves, they are talking about trends. Isn't it time you let the trends take care of you? |
| SUGGESTED READING Achelis, Steven B. [1995]. Technical Analysis From A To Z, Irwin Professional Publishing. Gifford, Elli 1995]. The Investor's Guide To Technical Analysis, Financial Times/Pitman Publishing. Headley, Price [2002]. Big Trends In Trading, John Wiley & Sons. Kahn, Michael [2006]. Technical Analysis: Plain And Simple, Financial Times/Pitman Publishing. Murphy, John J. [1996]. The Visual Investor, John Wiley & Sons. Connors, Laurence A., and Linda Bradford Raschke [1995]. Street Smarts: High Probability Trading Strategies For The Futures And Equities Markets, M. Gordon Publishing Group. Sperandeo, Victor [1991]. Trader Vic: Methods Of A Wall Street Master, John Wiley & Sons. Wilder, J. Welles [1978]. New Concepts In Technical Trading Systems, Hunter Publishing Co. |
Technical Writer for Technical Analysis of STOCKS & COMMODITIES magazine, Working-Money.com, and Traders.com Advantage.
| Title: | Traders.com Technical Writer |
| Company: | Technical Analysis, Inc. |
| Address: | 4757 California Avenue SW |
| Seattle, WA 98116 | |
| Phone # for sales: | 206 938 0570 |
| Fax: | 206 938 1307 |
| Website: | www.traders.com |
| E-mail address: | DPenn@traders.com |
Traders' Resource Links | |
| Charting the Stock Market: The Wyckoff Method -- Books | |
| Working-Money.com -- Online Trading Services | |
| Traders.com Advantage -- Online Trading Services | |
| Technical Analysis of Stocks & Commodities -- Publications and Newsletters | |
| Working Money, at Working-Money.com -- Publications and Newsletters | |
| Traders.com Advantage -- Publications and Newsletters | |
| Professional Traders Starter Kit -- Software | |
PRINT THIS ARTICLE

Request Information From Our Sponsors
- StockCharts.com, Inc.
- Candle Patterns
- Candlestick Charting Explained
- Intermarket Technical Analysis
- John Murphy on Chart Analysis
- John Murphy's Chart Pattern Recognition
- John Murphy's Market Message
- MurphyExplainsMarketAnalysis-Intermarket Analysis
- MurphyExplainsMarketAnalysis-Visual Analysis
- StockCharts.com
- Technical Analysis of the Financial Markets
- The Visual Investor
- VectorVest, Inc.
- Executive Premier Workshop
- One-Day Options Course
- OptionsPro
- Retirement Income Workshop
- Sure-Fire Trading Systems (VectorVest, Inc.)
- Trading as a Business Workshop
- VectorVest 7 EOD
- VectorVest 7 RealTime/IntraDay
- VectorVest AutoTester
- VectorVest Educational Services
- VectorVest OnLine
- VectorVest Options Analyzer
- VectorVest ProGraphics v6.0
- VectorVest ProTrader 7
- VectorVest RealTime Derby Tool
- VectorVest Simulator
- VectorVest Variator
- VectorVest Watchdog
