HOT TOPICS LIST
- Strategies
- Stocks
- Buy
- Investing
- Brokers
- Psychology
- Interviews
- Accumulate
- Sell
- Hold
- Spotlight
- Websites
- Candlestick Corner
- Gold & Metals
- Options Trading
LIST OF TOPICS
VIEWS FROM THE FIELD
Know Jack
10/04/06 02:23:41 PM PSTby David Penn
Educator, investor, trader ... Jack Steiman shows you how to move from emotion to "appropriateness."
| I remember listening to Jack Steiman a year ago on BusinessTalkRadio.net. At the time, the investor, trader, and newsletter author was hosting an investment radio show and making what likely seemed to many to be an impossible market call. In October 2005 the volatility index ($VIX) was ramping higher and the market plunged beneath support, taking three months' worth of higher lows with it. Many believed that the $VIX, which is considered an indicator of investor complacency, had bottomed that spring and, in its advance, foretold of increasing market weakness. Bears, still stung by the market's ability to rally from the October 2004 bottom, were newly emboldened by the idea that they'd only been off by a year. October 2005, many were convinced, would be the beginning of The End. Sound like a good time to go the other way? Jack Steiman thought so. He shared his opinion with thousands of investors and traders who regularly tuned into his radio program, saying: Don't panic. This market is going higher. And then the trouble started. "I remember almost being in tears," Steiman says today with a chuckle. He recalls being at a seminar in Atlantic City shortly after making the call. The NASDAQ had gapped down and Steiman felt as if he'd blown it, made the wrong call, and potentially cost his listeners thousands of dollars in what he started to fear were mistaken bets on the upside. "I remember saying, %91Well, technical analysis doesn't work' ..." he recalls. Yet he hadn't blown it. In fact, the market soon bottomed and headed sharply upward. The positive divergences that Steiman noted in making his call proved to be accurate forecasters of a bottom. "When you see a divergence," he explains, "rarely does it play out that day. There is a level of trust and patience" that is required. "Once you learn this stuff you have to trust it because it always tells the truth. You just have to trust it." |
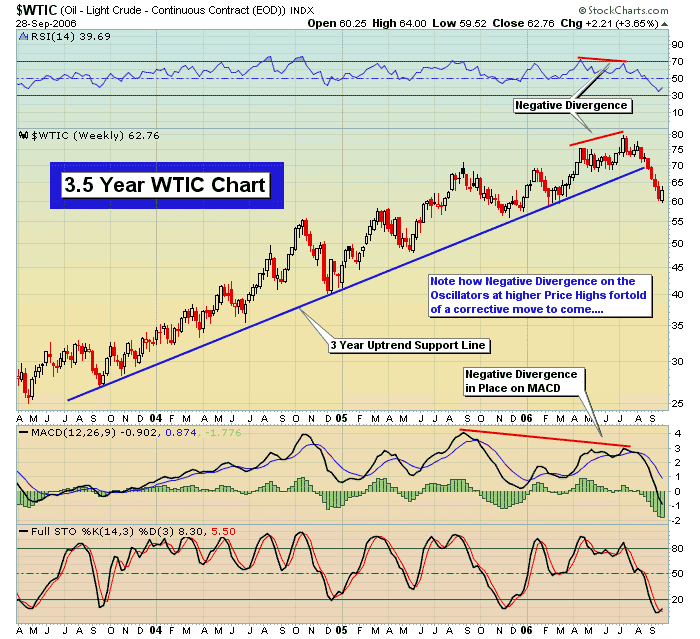
 FIGURE 1: OIL, LIGHT CRUDE, CONTINUOUS FUTURES, WEEKLY. Note how negative divergences on the oscillators at higher price highs foretold of a corrective move to come. THE RIGHT STUFF Steiman says he did well in his trading and investing at first, but it was his experience with the AOL–Time Warner merger that perhaps solidified the understanding of the markets that allowed him to take his trading to a higher level, that of a professional whose market insights and observations are sought out by retail and institutional investors nationwide. "When the Time Warner merger [with AOL] happened, and AOL did not go up," recalls Steiman, it was clear that something was wrong. In an era where just about every idea seemed to be all silver linings and no cloud, the failure of what appeared at first to be an ideal marriage of old and new media made a strong impression on Steiman and only intensified his respect for technical tools, including sentiment analysis. "There are a million tools," Steiman says, "and I respect them all." He is fully aware and appreciative of the work of technicians whose approaches and models differ from his, be they Elliott wave analysts, cycles experts, or old school price and volume chartists. However, he is not without his own preferred methods. High up on his list is the moving average convergence/divergence (MACD) indicator set for 12, 26, and 9 (histogram optional). It is the MACD that brings him news of the divergences key to his determination as to when a market is too high to buy or too low to sell. "Daily, 60-minute, 30-minute [charts] ... I want to make sure I'm on the right side of the market," he adds. Other secondary tools include the relative srength index (RSI) and the stochastic (Steiman uses the 90 and 20 levels to assess a market's overbought or oversold condition, respectively). Steiman will read divergences in these two indicators but prefers following the MACD. He is also a big fan of the 20-period exponential moving average (EMA), which he says provides "a greater area of support or resistance in a true bull or bear market." As far as he is concerned, the very popular 50- and 200-period moving averages are "helpful," but "when a market is really moving" it is the 20-period EMA he counts on. Beyond these technical tools, what does Jack Steiman look at? He admits that "macro [economics] has some play," as does fundamental analysis. But he insists the problem with using both varieties of analysis is that they only tell investors and traders "what has been," not what is coming. And knowing what is coming is what trading is all about. Says Steiman, "Things aren't always easily seen, but [they] can be predicted. The market, like a business, has a way of telling you something %91will be' that %91isn't' right now." Sector analysis is one tool that Steiman thinks is valuable for traders and investors. "Sector charts are important," he says. "Stocks and [their] sectors must confirm." He likes to look at the Dow Jones Industrial Average (DJIA), the Standard & Poor's 500, the NASDAQ, and the $SOX (Philadelphia Semiconductor Index), then move to his oscillators such as the MACD, then on to separate sectors. Sentiment analysis is also a key ingredient in Steiman's ability to anticipate market turns. "Let the technicals and sentiment lead," he suggests, and watch how heavily a sector is shorted, how many traders are playing the Rydex asset ratio, and what the level of the put-call ratio is. "Sentiment tells me what's coming," he says, but adds by way of conclusion, "still, price and volume confirmation on all of this is critical." |
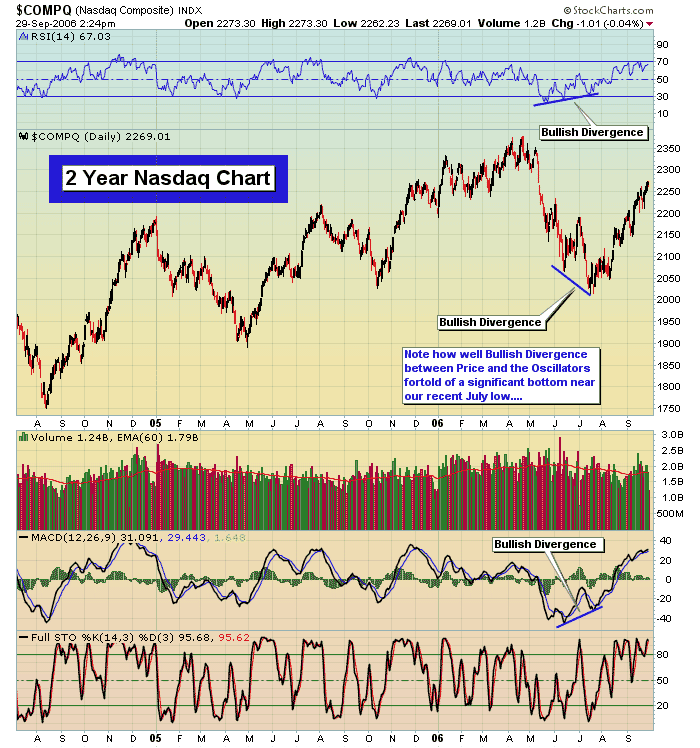
 FIGURE 2: NASDAQ COMPOSITE INDEX, DAILY. Note how well bullish divergences between price and the oscillators foretold of a significant bottom near our recent July low. TOMORROW'S MARKETS TODAY "The Fed is what killed the Naz," Steiman notes without hesitation when asked about the post-bubble market of the past few years. As far as he is concerned, what we experienced in 2000 was simply a correction in the DJIA, even if it was the "collapse of a speculative bubble" in high price/earnings stocks. As such, Steiman has little positive to say about the Federal Reserve Board chairman Alan Greenspan, whom he accuses of "overshooting" with persistent Fed funds rate hikes. Failure to recognize and appreciate the difference between productivity and inflation, says Steiman, is what proved Greenspan to ultimately be "incompetent," particularly in his final years at the helm of the Fed. With regard to Ben Bernanke, Greenspan's successor, Steiman believes Bernanke has "finally got it," after initially trying to play the "good guy" by continuing the Greenspan rate hikes. "I guarantee you that the next move from the Fed will be to drop [rates] and drop them quickly," Steiman adds, estimating 4% as "next year's level" of Fed funds. He believes the dramatic rally in Treasuries is the bond market's understanding that economic weakness is likely around the corner. Yet he is quick to add that economic weakness — or even a recession — does not necessarily mean a negative stock market; "2007 will be a phenomenal year," Steiman says confidently. Looking toward some more recent trends, Steiman was even more confident about the summer bottom in 2006 than he was about the October 2005 bottom. But his analysis homed in on the commodities advance that has been — at least up until recently — the toast of the trading and investing town. "Negative divergences were everywhere," Steiman says, "in just about every commodity on Earth. Gold, silver, steel, oil ..." And as far as he is concerned, commodities have further to fall, paving the way for advances in other areas such as financial instruments like stocks and bonds. "The commodity bull [market]," he notes, "was a bubble." And a commodity bubble, according to Steiman, ends when the commodities and the commodity stocks "don't confirm each other." That was his signal that the time for buying and being long the oil stocks and the gold stocks and the titanium stocks had come to an end. "The Rydex asset ratio was frothy on energy," he adds. There were "just too many [investors willing] to chase it." |
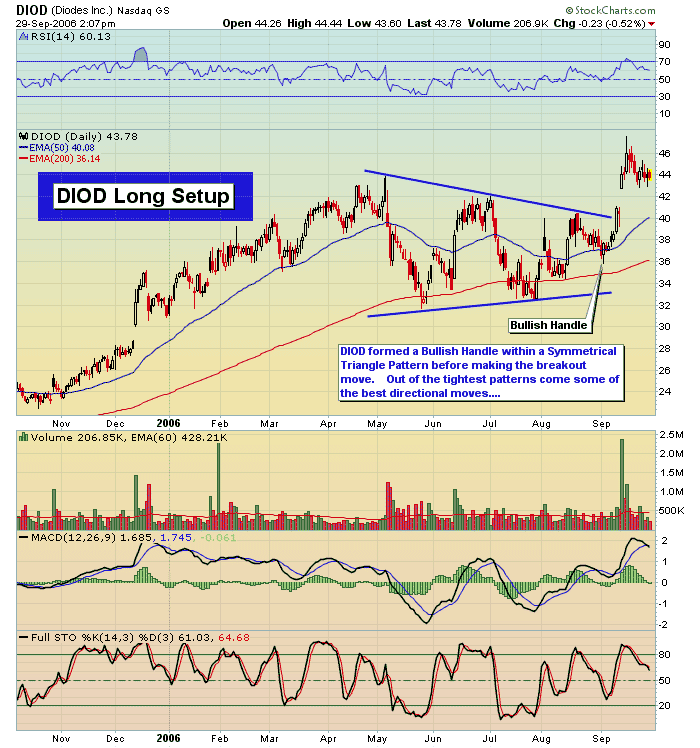
 FIGURE 3: DIOD, DAILY. DIOD formed a bullish handle within a symmetrical triangle pattern before making the breakout move. Out of the tightest patterns come some of the best directional moves. ON BEING "APPROPRIATE" "The stock market is the most difficult game on planet Earth," Steiman announces without hesitation. "If you play it with emotion ... [if you] start to see what you want to see rather than what the market message is really telling [you] ..." All these are roads to trading ruin as far as he is concerned. Although most traders don't like to hear it — preferring perhaps to embrace the spirit if not the letter of Gordon Gekko's famous dictum (borrowed from legendary — and disgraced — arbitrageur Ivan Boesky) that "greed is good" — the fact of the matter is that a certain measure of "greed" is working within the souls of everyone who engages the financial markets to speculate and make money. But Steiman opines that those who can harness that greed, who can understand while "greed" may have gotten them in the stock game, only controlling greed will allow them to leave the game with more than their clenched fists in their pockets, can often find fortune — even big fortune — in this "most difficult game." Jack Steiman's analysis of both the markets and the "kind of mind" necessary to invest and trade in them effectively will be available again to investors and traders through his new website, TheInformedTrader.com, scheduled to launch in October 2006. The website will feature nightly market commentary, intraday updates, alerts for both long and short stock trades, exchange traded fund analysis (including ProShares), an "IPO Corner," daily chart updates, a message board, and other educational materials. In addition, Steiman will continue to teach seminars both live and online to interested parties. All this — from the radio show he hosted for two years to the upcoming TheInformedTrader.com website — comes from Steiman's desire to educate would-be and aspiring investors and traders. As a self-taught market player, he understands how difficult it can be for someone just starting out, or for someone who has been investing and/or trading poorly and is looking for a way to right the ship. This isn't easy, given the number of distractions and the amount of what might only be called misinformation the average investor has to wade throughto understand what is really — and really not — at work in the financial markets. Few things, it seems, make Jack Steiman more concerned than seeing the amount of discussion in the media about the markets available to investors and traders today, talk that often reflects "no understanding of what makes the market move up and down." Says Steiman, "People try to make people think something is happening. They look for something they can say. [They] just don't understand the game, so they come up with a reason or an excuse." "The intent is good," he offers. "But the information is false. People [are] being led down the wrong road." So what is the right road? Balance ... confidence ... trust ... patience ... all gathered under Steiman's perhaps signature phrase "appropriateness." "If you go into the market peacefully," Steiman says, "saying %91I'm just trying to make a buck, take care of my family,' without letting emotions get in the way ..." that's how he believes the market should be played. "I don't know anyone who has made money [in the markets] who had to [make money]," he adds. The need for this sort of objectivity and emotional stability is partly why technical analysis can be such a boon to the dispassionate trader. "When you start to play big," he says, "you play on big emotions. And if you play with greed, you're playing with emotions." |
Technical Writer for Technical Analysis of STOCKS & COMMODITIES magazine, Working-Money.com, and Traders.com Advantage.
| Title: | Traders.com Technical Writer |
| Company: | Technical Analysis, Inc. |
| Address: | 4757 California Avenue SW |
| Seattle, WA 98116 | |
| Phone # for sales: | 206 938 0570 |
| Fax: | 206 938 1307 |
| Website: | www.traders.com |
| E-mail address: | DPenn@traders.com |
Traders' Resource Links | |
| Charting the Stock Market: The Wyckoff Method -- Books | |
| Working-Money.com -- Online Trading Services | |
| Traders.com Advantage -- Online Trading Services | |
| Technical Analysis of Stocks & Commodities -- Publications and Newsletters | |
| Working Money, at Working-Money.com -- Publications and Newsletters | |
| Traders.com Advantage -- Publications and Newsletters | |
| Professional Traders Starter Kit -- Software | |
PRINT THIS ARTICLE

Request Information From Our Sponsors
- StockCharts.com, Inc.
- Candle Patterns
- Candlestick Charting Explained
- Intermarket Technical Analysis
- John Murphy on Chart Analysis
- John Murphy's Chart Pattern Recognition
- John Murphy's Market Message
- MurphyExplainsMarketAnalysis-Intermarket Analysis
- MurphyExplainsMarketAnalysis-Visual Analysis
- StockCharts.com
- Technical Analysis of the Financial Markets
- The Visual Investor
- VectorVest, Inc.
- Executive Premier Workshop
- One-Day Options Course
- OptionsPro
- Retirement Income Workshop
- Sure-Fire Trading Systems (VectorVest, Inc.)
- Trading as a Business Workshop
- VectorVest 7 EOD
- VectorVest 7 RealTime/IntraDay
- VectorVest AutoTester
- VectorVest Educational Services
- VectorVest OnLine
- VectorVest Options Analyzer
- VectorVest ProGraphics v6.0
- VectorVest ProTrader 7
- VectorVest RealTime Derby Tool
- VectorVest Simulator
- VectorVest Variator
- VectorVest Watchdog
