HOT TOPICS LIST
- Strategies
- Stocks
- Buy
- Investing
- Brokers
- Psychology
- Interviews
- Accumulate
- Sell
- Hold
- Spotlight
- Websites
- Candlestick Corner
- Gold & Metals
- Options Trading
LIST OF TOPICS
OPTIMIZED TRADER
Trading DI+/-
10/12/06 12:07:03 PM PSTby David Penn
Can directional movement analysis improve your trading results?
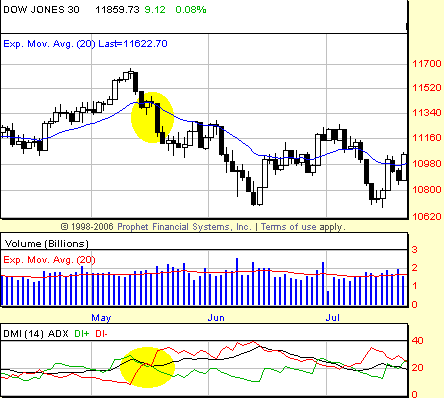
In a recent article for Working-Money.com, I mentioned some of the ways traders use the various indicators derived from or oriented around directional movement ("What's In A Trend?" September 12, 2006). Directional movement is a concept developed by legendary market technician J. Welles Wilder, who introduced this type of analysis in his book New Concepts In Technical Trading Systems. To provide an indication of how highly Wilder thought of his work in directional movement, consider his introduction to the topic:Directional movement is the most fascinating concept I have studied. Defining it is a little like chasing the end of a rainbow...you can see it, you know it's there, but the closer you get to it the more elusive it becomes. I have probably spent more time studying directional movement than any other concept. Certainly one of my most satisfying achievements was the day I was actually able to reduce this concept to an absolute mathematical equation. And fortunately for the mortals among us, Wilder's work in directional movement has been further "reduced" for ease of use and to analyze technical indicators found on most if not all of the most common online and standalone technical analysis platforms. What is directional movement? Here's Wilder's explanation: Think of the implications of being able to rate the directional movement of any or all commodities or stocks on a scale of zero to one hundred. If you use a trend-following method, you would trade only those commodities that are in the upper end of the scale. If you are using a system that capitalizes on choppy or non-trending markets, then you would trade only those commodities at the lower end of the scale... With this Wilder is principally concerned with determining which stocks or commodities to trade based on (1) a higher or lower directional movement, as well as (2) a trading method that exploits greater or lesser directional movement. So here directional movement is treated more as a screen or filter than as a "buy/sell" indicator in and of itself. This way of using directional movement remains common among many traders, who look for certain levels of directional movement to indicate the presence of a tradable trend. However, there are a number of other uses and methods by which technical traders have deployed directional movement (and its chief derivative, the average directional movement index, or ADX) in order to make profitable trades on a variety of instruments over a variety of different time frames. THE CROSSOVER This rule is designed to prevent whipsaws and reduce the number of trades. The extreme point rule requires that on the day that the +DI and the -DI cross, you note the %91extreme point.' When the +DI rises above the -DI, the extreme point is the high price on the day the lines cross. When the +DI falls below the -DI, the extreme price is the low price on the day the lines cross. Let's look at an example of both the crossover and the extreme point rule. Figure 1 shows the Dow Jones Industrial Average (DJIA) over the past six months. We're going to focus on the May and July periods. In addition to the ADX and DI+/DI-, I've added a 20-day exponential moving average (EMA) -- a favorite of trader and investor Jack Steiman (see my Working-Money.com profile, "Know Jack" from October 4, 2006) -- just to put the price action in historical perspective. The bearish DI- line makes a low on May 10 -- a low simultaneous with the closing high in the Dow 30. Over the next few days, the DI- line rises, eventually intersecting and crossing over the bullish DI+ line on May 15. Looking back to the price chart (Figure 1), we note this date is one day after the Dow 30 broke down below its 20-day EMA. Based on the crossover method for trading directional movement, we would now have a sell signal in the DJIA. |
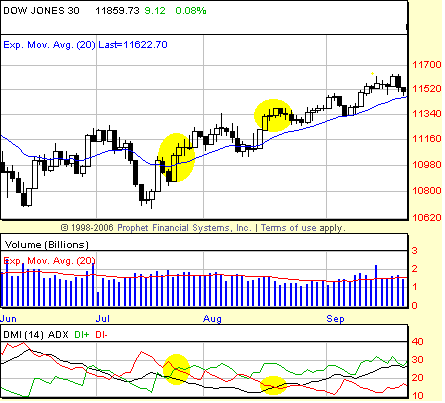
 FIGURE 1: DJIA DAILY. The low in the DI- line arrives on the same day that the DJIA topped in May. The crossover of the DI- line above the DI+ line a few days later provided traders with the signal to go short. But what about a more precise entry? Here's where the "extreme point rule" comes into play. The day that the DI- crosses over the DI+ (May 15) the price low in the DJIA is approximately 11,333. That is the entry target on the short side. Selling the Dow short at that point would have provided for a short entry two days later on May 17 -- a day during which the DJIA broke down in earnest (approximately 205 points from open to close). A swing trader would have likely taken at least partial profits during this swoon, and traders with a slightly longer time frame would have been richly rewarded as the DJIA over the next month fell to a closing low of 10706 -- some 627 points below our short entry. Those gains would have mitigated a losing DI+/- trade in late June. You can see how the DI+ line crossed back above the DI- line as the Dow 30 attempted to bounce back from the mid-June lows. With an extreme point created just north of 11195, DI+/- traders would have gone long in late June or early July only to see the DJIA sink back below the 20-day moving average en route to a test of the June lows. But even here, aggressive DI+/- traders might have caught a break by betting against the Dow when the DI- line crossed back above the DI+ line on July 11 -- creating an extreme point to the short side at 11027. A fill the following day would have allowed aggressive DI+/- traders to ride the DJIA lower over the next few days, picking up a chunk of the 288 points between the entry and the closing low on July 14. |
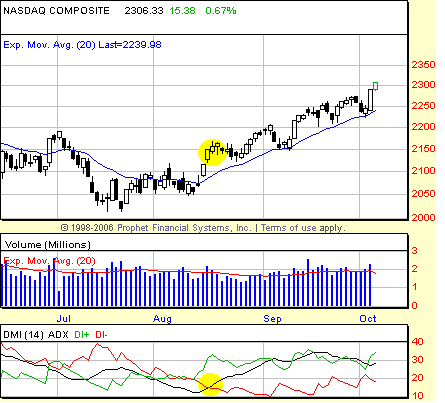
 FIGURE 2: DOW JONES INDUSTRIAL AVERAGE, DAILY. The DI+ (in green) cross over the DI- line (in red) in late July is confirmed when the ADX (in black) crosses over the lower of the two lines, the DI- line a few week later. If that wasn't enough, directional movement proved to be the gift that kept on giving come mid-July when there was another bullish crossover. Rallying from a slightly higher low in July compared to the low in June, the DI+ line crossed above the DI- line on July 25. This was just as the DJIA was itself crossing above the 20-day EMA. Creating an extreme point at about 11133, the DI+/- trading methodology provided for a long entry on the following day. The Dow Jones Industrial Average hasn't traded below that long entry point since. What's more, when there was a bearish sell signal in the DI+/- on August 10, the extreme point rule helped keep traders from either exiting the long position (if they were using the DI+/- method for both entries and exits) or from initiating new shorts. While an extreme sell point at 11044 was created, the lack of follow-through -- even on an intraday basis -- to the downside ensured traders would not get "bucked off" a great bull market run. THE AVERAGE The Average Directional Indicator ADX rises when the spread between Directional lines increases. This shows that market leaders are becoming stronger, losers are getting weaker, and the trend is likely to continue. When the ADX rises, it pays to trade in the direction of the upper Directional line, using a trend-following method. In my recent article on trends (see my "What's In A Trend?" in Working-Money.com from September 12, 2006), I quoted Price Headley (bigtrends.com) who discussed his personal trading preferences involving directional movement. Without repeating the entirety of what was written, I will iterate this point of his that underscores the idea of a rising ADX line that Elder discussed. What I look for is ADX coming off a low level, preferably under 20, and then not only turning up, but also crossing above the lower DM line to suggest a forceful trend is developing. You can see how many different strands of thought come together. If a low ADX suggests a lack of trend, then spotting an instance where a trendless market is developing a trend can provide for a great opportunity to the long or short side. And noting what Elder suggests about following the lead of the higher of the two directional lines dovetails nicely with Headley's point about the ADX overtaking and crossing over the lower of the two directional lines. Elder emphatically makes this point later in his discussion of what he calls the Directional System: The single best signal of the Directional system comes after ADX falls below both Directional lines. The longer it stays there, the stronger the base for the next move. When ADX rallies from below both Directional lines, it shows that the market is waking up from a lull. When ADX rises by four steps (i.e., from 9 to 13) from its lowest point below both Directional lines, it %91rings a bell' on a new trend. It shows that a new bull market or bear market is being born. Let's look at an example of the ADX in action. This time, we'll use the NASDAQ Composite. What we are looking for is an instance in which the ADX line (here in black) falls below the two directional lines DI+ and DI- (Elder's version) and/or falls below 20 (Headley's). Ideally, our market will have an ADX that is doing both. Looking at the NASDAQ Composite chart in Figure 3, we see that the ADX fell below both DI+ and DI- on the last trading day of July 2006. The ADX also fell below the 20 level on that date, so both of the conditions we established at the outset were met. Now we need to see the ADX rally and cross above the lower of the two lines. In the context of the lows in price that were created then, an ADX that crossed above the DI+ line would be bearish and suggest the likelihood of another breakdown, whereas an ADX that crossed above the DI- line would be bullish and suggest that the NASDAQ Composite had bottomed in July. |
 FIGURE 3: NASDAQ COMPOSIITE, DAILY. Bottoming at a particularly low level in mid-August, the ADX (in black) cross up and over the DI- line (in red) let traders know that the NASDAQ was ready to move higher. As it turned out, the ADX line crossed above the bearish DI- line on August 17, three days after the DI+ line crossed above the DI- line. The move in the ADX provided a buy signal or, if you prefer, confirmation of the buy signal provided days earlier from the DI+/DI- crossover. Application of the same "extreme price rule" in this instance would call for an entry on August 18 and the trader -- unlike in our previous examples with the simple DI+/DI- crossover -- would have suffered some short-term losses before the position moved more enduringly into the black (an entry at 2149 would have seen the position slide to an intraday low of 2122 five days later). This might mean the ADX crossover is better suited for purposes of confirmation of the DI+/DI- crossover signal, or perhaps that traders should see an ADX crossover as an alert and wait to enter the market on a subsequent pullback (if looking to trade from the long side) or bounce (if looking to trade from the short side). FIND YOUR DIRECTION SIGN When I've got a list of "new bull trend" and "new bear trend" sectors, I zoom in to look at the constituents or components of that sector. Sometimes I continue with the ADX and DI+/- with this zoom in view, other times I use other favorite screens like my BOSO screen (see my Working-Money.com article from October 5, 2005 to learn more about the "buying overbought/selling oversold" BOSO setup). Still other times I go indicator-agnostic and simply look for price setups like 2B tops and bottoms, 1-2-3 trend reversals; basic chart patterns like triangles, flags, and cups with handles, as well as old-fashioned high-volume price breakouts and breakdowns. The idea is to have as many worthwhile technical tools as you can understand, and allow them to compliment and confirm each other when you are trying to decide which markets to trade. Given the combination of being able to determine the presence of a trend as well as providing entry levels for traders to exploit those trends after they have been discovered, the ADX and DI+/- seem to be as worthy of being a part of your technical trading toolkit as any other indicator you are likely to find. |
| SUGGESTED READING Achelis, Steven B. [1995]. Technical Analysis From A To Z, Irwin Professional Publishing. Elder, Alexander [1993]. Trading For A Living, John Wiley & Sons. Headley, Price [2002]. Big Trends In Trading, John Wiley & Sons. Wilder Jr., J. Welles [1978]. New Concepts In Technical Trading Systems, Hunter Publishing Co. |
Technical Writer for Technical Analysis of STOCKS & COMMODITIES magazine, Working-Money.com, and Traders.com Advantage.
| Title: | Traders.com Technical Writer |
| Company: | Technical Analysis, Inc. |
| Address: | 4757 California Avenue SW |
| Seattle, WA 98116 | |
| Phone # for sales: | 206 938 0570 |
| Fax: | 206 938 1307 |
| Website: | www.traders.com |
| E-mail address: | DPenn@traders.com |
Traders' Resource Links | |
| Charting the Stock Market: The Wyckoff Method -- Books | |
| Working-Money.com -- Online Trading Services | |
| Traders.com Advantage -- Online Trading Services | |
| Technical Analysis of Stocks & Commodities -- Publications and Newsletters | |
| Working Money, at Working-Money.com -- Publications and Newsletters | |
| Traders.com Advantage -- Publications and Newsletters | |
| Professional Traders Starter Kit -- Software | |
PRINT THIS ARTICLE

Request Information From Our Sponsors
- StockCharts.com, Inc.
- Candle Patterns
- Candlestick Charting Explained
- Intermarket Technical Analysis
- John Murphy on Chart Analysis
- John Murphy's Chart Pattern Recognition
- John Murphy's Market Message
- MurphyExplainsMarketAnalysis-Intermarket Analysis
- MurphyExplainsMarketAnalysis-Visual Analysis
- StockCharts.com
- Technical Analysis of the Financial Markets
- The Visual Investor
- VectorVest, Inc.
- Executive Premier Workshop
- One-Day Options Course
- OptionsPro
- Retirement Income Workshop
- Sure-Fire Trading Systems (VectorVest, Inc.)
- Trading as a Business Workshop
- VectorVest 7 EOD
- VectorVest 7 RealTime/IntraDay
- VectorVest AutoTester
- VectorVest Educational Services
- VectorVest OnLine
- VectorVest Options Analyzer
- VectorVest ProGraphics v6.0
- VectorVest ProTrader 7
- VectorVest RealTime Derby Tool
- VectorVest Simulator
- VectorVest Variator
- VectorVest Watchdog
