HOT TOPICS LIST
- Strategies
- Stocks
- Buy
- Investing
- Brokers
- Psychology
- Interviews
- Accumulate
- Sell
- Hold
- Spotlight
- Websites
- Candlestick Corner
- Gold & Metals
- Options Trading
LIST OF TOPICS
TRADER'S NOTEBOOK
Mining For Maximum Shine
10/25/06 12:51:27 PM PSTby Matt Blackman
When it comes to metals, there's a time to buy and a time to sell. Here's a way your computer can help you find the sweet spots.
| As any trader worth his or her salt learns early, timing is the single most important component to any strategy. Buy or sell even the best potential performers at the wrong time and you can lose your shirt. But we technical traders are supposed to know better -- or so goes the theory. "One big difference between commodities [futures] and stocks is that the former have very definite rhythms," points out Darrell Jobman, editor-in-chief of TradingEducation.com. "Unlike stocks, futures do not continue moving higher for years on end, and they rarely if ever go to zero." Futures traders have long employed cycles to time buys and sells based on periodic demand and supply paradigms, which can vary greatly. Natural product futures such as grains, meats, and softs (lumber, cocoa, and cotton, for example) have definite growing and harvest seasons that affect prices. The same is true when it comes to exploration and recovery of energies and minerals. Over the years, traders have learned that tracking crop and weather reports are helpful in choosing times to buy and sell, and seasons play a big part in this process. When it comes to metals, seasons are also important for two reasons. First, exploration and recovery is often highly weather dependent. So are periods of high demand (as in, say, Christmas). Interestingly, however, precious metals such as gold and silver have different supply-demand cycles so it is necessary to know what drives the underlying fundamentals before trading them. Assuming any two are alike can be a costly mistake. Learning these fundamentals takes time -- lots of it. Surely, in this day and age of high-speed computers, there must be a better way. |
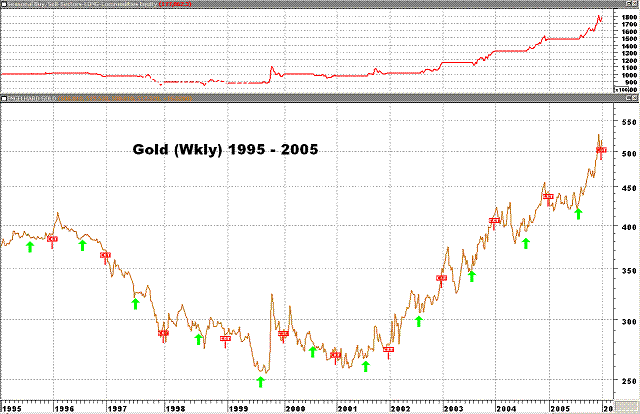
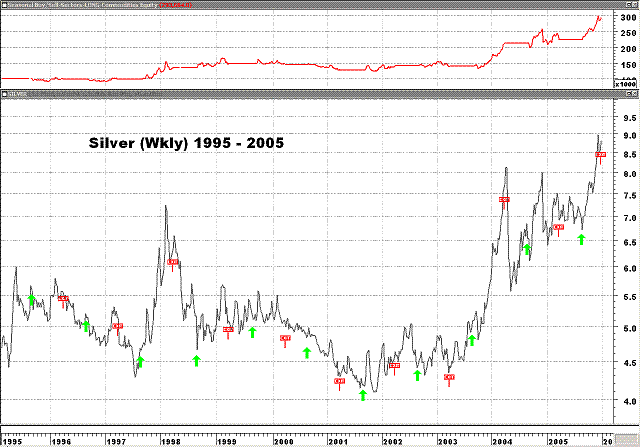
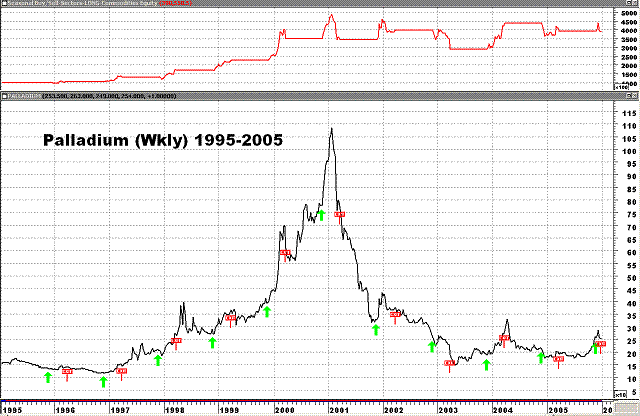
| CYCLES 2 WIN The good news is yes, but more about that later. According to The Encyclopedia Of Commodity And Financial Spreads, the Handy and Harmon gold seasonal pattern has a low in late April and another in late July-early August, based on 15 years of data. A number of the widely used computer charting programs allow traders to test for optimal buy and sell times. But test the data over different periods and you will find this has changed over time. Employ five years of data (2000-05) and the graph looks different with a low in late April followed by another low in late July after which gold prices move up to the end of the year (see Figure 1). Figures 2 and 3 show weekly charts of silver and palladium.
|
For our study, we decided on a period of 10 years between 1995 and 2005 using the backtesting function in MetaStock. Below is the formula to test a known period. Say we want to determine how profitable a system is that buys gold at the July low and sells at the December high, buying and selling in the last week of the month:----------------------------------------------------------------------- This formula will work well to determine the returns over various periods by buying and selling at specific times of the year. |
| LET YOUR COMPUTER DO THE WALKING So far, we have worked with the assumption you knew the best season to buy and sell and simply wanted to compare results over different periods. What if you weren't sure what the optimal season was? You could spend hours poring over stacks of commodity books to find the answer. Even if you did, there would be no guarantee the information you'd glean would be correct, since season patterns have a habit of changing over time. This is where a computer, a charting program, and some formula language knowledge can be a lot of help. Using our logic above, here is the formula for finding the optimal buying and selling periods: ----------------------------------------------------------------------- This tells your computer to test for the best buying and selling times over a given period. The test requires 144 runs (12 months for buys multiplied by 12 months for sells), which should take the average computer today less than a minute. However, this assumes you are going to stick with buying and selling during the last week of the month. If you also want to test for the best day of the month, it requires two more variables (optimization periods). The formula looks like this: ----------------------------------------------------------------------- Assuming you test every other day, this requires the computer to run 32,400 tests, which will take considerably longer. Another option is to run two separate tests, the first to find the best months to buy and sell using the last week, then rerunning the tests to find the best days of the month. Figure 4 shows the results of our tests on weekly metals data. The test period covered a total of 573 weeks or 4,011 days between January 4, 1995, and December 30, 2005.
|
| CYCLE TRAP AVOIDANCE Those who have conducted extensive backtesting will tell you it is easy to fall prey to any number of traps when testing for new systems. The biggest mistake many new traders make is assuming that because a test works, it will make money in real life. This is not necessarily so. This is why it's important, once you have completed your tests over various periods and developed what you think will be a killer new trading program, to test it first in out-of-sample data, completely separate from the periods used in your tests. If the system is good, results should hold up. However, more often than not, you will be dismayed that the results fall dramatically. Assuming your system survives rigorous out-of-sample tests, the next step is to test it in real time using a simulated account. Many brokers now offer this service to allow traders to test their acumen before risking real money. A number of these systems are better than paper-trading because they utilize real data and fill conditions to execute simulated trades. This will avoid cases of curve-fitting (designing your system to work over the test period by overoptimization). In most cases, you will find results will vary, depending over what period you test your cycle system. This process for developing a trading system is not restricted to metals. It works for testing any futures, currency, bond, or stock. If backtesting over different periods fails to generate consistent results, it means either there is no tradable cycle or the cycle changes often. Discard the subject of the test and move on. However, if you determine a market has seasonal lows in, say, July in the case of gold but is putting in new highs when the seasonal time to buy comes around, what do you do then? That will depend on what other technicals are saying. Is gold in an uptrend with trendline support? Buying the next time it hits support and setting stops just below the trendline is the course of action. If gold breaks support, you are out for a small loss, but if you have caught the season correctly and bought on weakness, then you stand to profit. All good systems should be used in conjunction with confirming technicals to reduce the chance of failure and account meltdown. Cycles are one more technical tool to help you decide the best times to buy and sell your metals. With a little luck, some computer know-how, and a lot of hard work, you even stand a good chance of making money! Matt Blackman, market analyst for www.TradingEducation.com , a free educational website, is a technical trader, author, reviewer, and keynote speaker whose work has appeared in a number of major financial publications, websites, and newsletters. He is a member of the Market Technicians Association (MTA) and Technical Securities Analysts Association (TSAA). SUGGESTED READING Upperman, Floyd [2006]. Commitments Of Traders: Strategies For Tracking The Market And Trading Profitably, John Wiley & Sons Williams, Larry [2006]. Trade Stocks & Commodities With the Insiders -- Secrets Of The COT Report,John Wiley & Sons. Seasonality in Industrial Commodities and Equity Indexes http://dvtechtalk.com/specialreports/specialreport7.htm |
Matt Blackman is a full-time technical and financial writer and trader. He produces corporate and financial newsletters, and assists clients in getting published in the mainstream media. He tweets about stocks he is watching at www.twitter.com/RatioTrade Matt has earned the Chartered Market Technician (CMT) designation.
| E-mail address: | indextradermb@gmail.com |
PRINT THIS ARTICLE

|

Request Information From Our Sponsors
- StockCharts.com, Inc.
- Candle Patterns
- Candlestick Charting Explained
- Intermarket Technical Analysis
- John Murphy on Chart Analysis
- John Murphy's Chart Pattern Recognition
- John Murphy's Market Message
- MurphyExplainsMarketAnalysis-Intermarket Analysis
- MurphyExplainsMarketAnalysis-Visual Analysis
- StockCharts.com
- Technical Analysis of the Financial Markets
- The Visual Investor
- VectorVest, Inc.
- Executive Premier Workshop
- One-Day Options Course
- OptionsPro
- Retirement Income Workshop
- Sure-Fire Trading Systems (VectorVest, Inc.)
- Trading as a Business Workshop
- VectorVest 7 EOD
- VectorVest 7 RealTime/IntraDay
- VectorVest AutoTester
- VectorVest Educational Services
- VectorVest OnLine
- VectorVest Options Analyzer
- VectorVest ProGraphics v6.0
- VectorVest ProTrader 7
- VectorVest RealTime Derby Tool
- VectorVest Simulator
- VectorVest Variator
- VectorVest Watchdog


