HOT TOPICS LIST
- Strategies
- Stocks
- Buy
- Investing
- Brokers
- Psychology
- Interviews
- Accumulate
- Sell
- Hold
- Spotlight
- Websites
- Candlestick Corner
- Gold & Metals
- Options Trading
LIST OF TOPICS
MARKET COMMENTARY
To Catch A Falling Knife
12/28/06 11:11:24 AM PSTby Matt Blackman
Are homebuilders a buy yet?
| Over the past year, homebuilder stocks have been pummeled. The S&P Homebuilding Select Index (SPHOME) dropped 44% before recovering mid-July, while the Philadelphia Housing Sector Index (HGX), which is made up of 20 national builders and building suppliers, dropped 36%. In the process, both indexes flashed a chart pattern that has been known to strike fear into the hearts of even the most aggressive bulls -- the bearish head & shoulders pattern. The H&S pattern began forming in December 2004 and was confirmed in May 2006 when the necklines were breached on both indexes. It has been interesting to listen to industry cheerleaders and financial analysts (who are for the most part -- can I use the "f" word? -- fundamentalists) explain the situation in the media. In the early stages of the slowdown that began in 2005, these cheerleaders proclaimed that slowing sales and building inventories were part of a healthy pause in a long-term uptrend. When sales kept falling, they opined it was a temporary leveling off from which demand would again reassert itself. And as inventories and sales accelerated in the opposite direction in mid-2006, they declared that it was part of a healthy correction but that prices would hold firm. But then the unthinkable happened. For the first time in decades, home prices began to fall. By September 2006, median new- and used-home prices had dropped more than 10% across the nation, the biggest yearly drop since 1970. By early November, median new-home prices had also fallen 9.7% below 2005 levels and buyer contract cancellation rates had soared to 40%, even though it often meant walking away from deposits worth tens of thousands of dollars. It was the first time in history that cancellations spiked in the absence of a recession, according to Amy Crews Cutts, deputy chief economist at Freddie Mac. Then in mid-November, while the National Association of Homebuilders housing market index was in the midst of a dead-cat bounce off lows not seen since 1991, came the news that October housing starts had again dropped, but this time by 14.6% to a six-year low while October building permits dropped 6.3%. What did the analysts have to say? In a November 20th survey published by The Wall Street Journal, economists proudly declared the worst of the housing bust over by a margin of nearly 2-to-1. One well-known TV personality on CNBC even touted homebuilders as a buy, singling out DR Horton (DHI) as a particularly good candidate. It should come as no surprise to find out that he admitted on air to being a value investor who likes to buy when there is blood in the streets. END OF THE TUNNEL OR AN ONCOMING TRAIN?
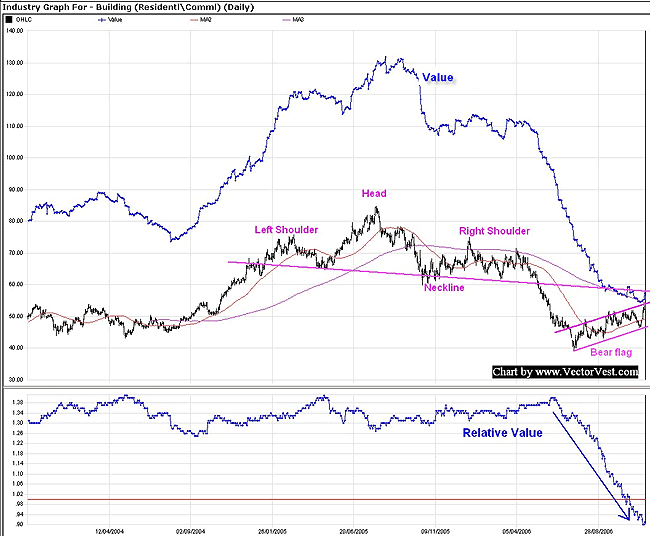
Figure 1 shows a chart of the building (residential-commercial) index made up of 26 homebuilders. From a technical perspective, 16 stocks (61.5%) were rated as buys, seven (26.9%) were holds, and only three (11.5%) were sells as of mid-November (as of mid-December, the ratio was little changed with 17 buys, seven holds, and two sells). As we can see, the building index resumed what appears to be an uptrend since bottoming with the rest of the market in mid-July. So from a short-term technical standpoint, stocks were demonstrating the series of higher lows and higher highs associated with a rally. The index also moved back above its 50-day moving average (MA) and was nearing its 200-day MA.
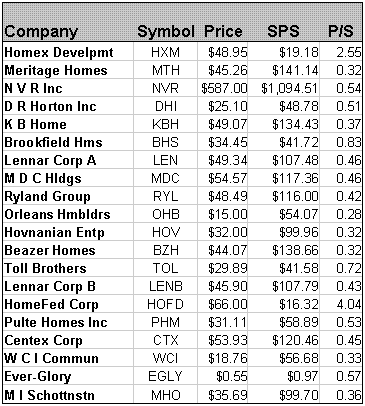
Figure 2 shows the top 15 of 26 companies in the homebuilding index, rated from best to worst showing company, symbol, sales per share (SPS), and price/sales (P/S) ratios. Prices shown are as of the close of trading on November 17. |
| Before looking at the charts, here is an explanation of the terms used. Value (blue line in the stock price graph) is a measure of a stock's current worth and computed from forecasted earnings per share, forecasted earnings growth, profitability, interest, and inflation rates. Value increases when earnings per share, the earnings growth rate and profitability increase, and when interest and inflation rates decrease. The goal is to purchase when the stock price is below the value line. Relative value (blue line in the lower subgraph) is an indicator of long-term price appreciation potential and is superior to a simple comparison of price and value because it is computed from an analysis of projected price appreciation three years out, AAA corporate bond rates, and risk. Again, the idea is to purchase stocks with relative value ratings above 1.00 (value is higher than stock price). Our next measure is growth rate (red line), which is the earnings growth rate and reflects a company's one- to three-year forecasted earnings outlook expressed in percentage per year. Growth rates are computed weekly from historical, current and forecasted earnings data and often foretell a stock's future price trend: If a stock's growth rate trend is upward, the stock's price will likely rise so it's best to purchase stocks where the growth rate is rising and is greater than the sum of current inflation and interest rates that as of November 17 equaled 7.07%. Earnings per share (black line) represent the forward 12 months' earnings per share and are determined from a combination of recent earnings performance and traditional fiscal and/or calendar year earnings forecasts. It is desirable to find companies where earnings per share are positive and increasing. For a more detailed explanation of these terms, please refer to www.vectorvest.com/definitions. As we see from Figure 1, the situation for homebuilders as a group has deteriorated significantly since July 2005. Both value and relative value have been pummeled, with the latter having dropped 36% from 1.40 to 0.90. |
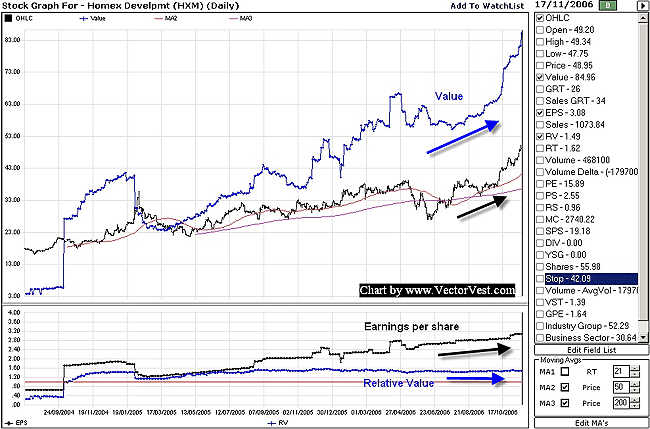
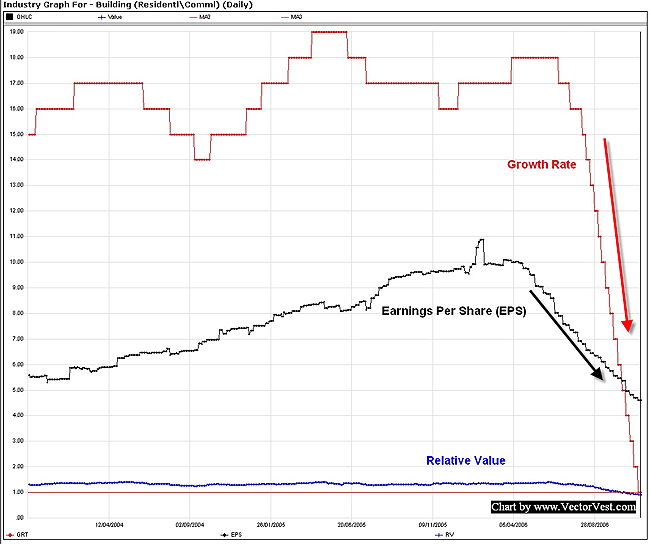 Figure 3: EARNINGS PER SHARE (EPS) VS. GROWTH RATE. Here you see the lower subgraph from Figure 1 showing relative value (blue line), earnings per share (black line) and growth rate (red line) for the homebuilders index in Figure 1. Both are falling faster than relative value. The average growth rate for homebuilders has fallen from 19% in May 2005 to just 1% by mid-November 2006 and is showing no signs of leveling off. Earnings per share have declined from an average just below $11 per share to $4.61 by mid-November. Figure 3, another set of metrics for the index in Figure 1, shows a similar picture for the growth rate, which has dropped from 18% in June 2006 to just 1% in November and to -1% by mid-December. Earnings per share also dropped from a peak of $10.89 in February 2006 to $4.61 in November and to $3.99 by mid-December. Further, there are no signs in a slowing of this decline, as some analysts would have you believe. How have homebuilder stocks fared? First, we looked at the top-rated company in Figure 2. Desarrolladora Homex (HXM) (also known as Homex Development) trades on the NYSE. It is a large Mexican builder and developer that for the year ended December 31, 2005, sold 31,594 homes, and had 67 developments under construction in 26 cities located in 17 Mexican states, according to The Wall Street Journal (see Figure 4).
|
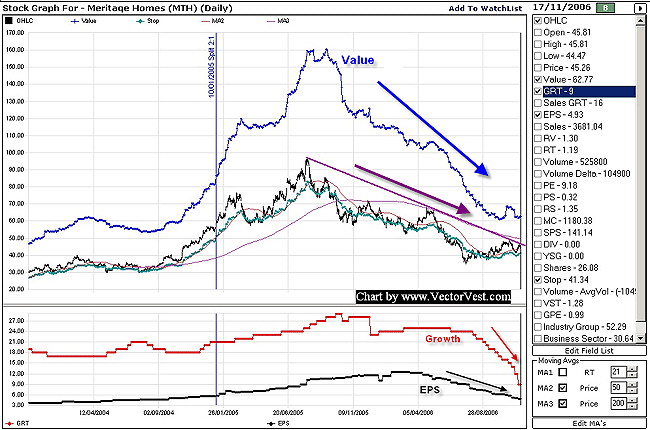
| Contrast this with the second-ranked homebuilder in Figure 2, Meritage Homes (MTH) (see Figure 5). While value, relative value, and earnings per share were growing for Homex, they were all declining for Meritage Homes. Growth was almost been cut in half between October 2005 and November 2006, declining from 29% to 16%. The negative-sloping top trendline in Figure 4 (magenta line) shows that the stock was still in a downtrend, and until price breaks above the magenta line and stays above it, this trend will continue. A similar top trendline exists for homebuilders in Figure 6.
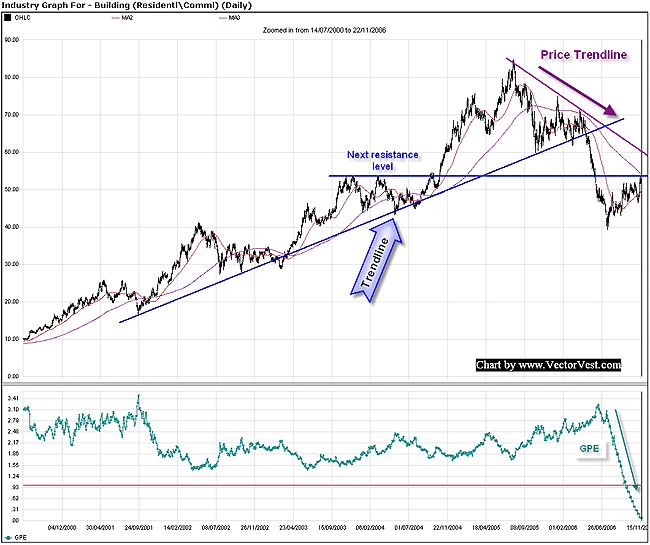
Let's take one last look at the building (residential/commercial) index, but this time with trendlines and GPE (growth to price/earnings) in the lower subgraph of Figure 5. The higher the GPE, the more undervalued a stock is considered to be. With current long-term rates near 5.75%, a GPE of 0.33 or less means it's overvalued. GPE rose from 2005 through mid-2006 even as the building index was falling, but in June after reaching a high of 3.22, GPE began to drop. By the third week in November 2006, it had declined to just 0.08, making the index extremely overvalued. The situation continued to worsen, with GPE hitting -0.07 in mid December. Trendlines confirm a bearish long-term picture with blue trendlines showing the long-term uptrend that was broken in May at the next resistance point (horizontal blue line), while the magenta trendline shows overhead resistance in the current downtrend. The index was approaching overhead resistance in November. DEADLY HABIT Looking at the charts, it is premature to say that the industry has recovered, especially considering that the pattern in Figure 1 has all the makings of a bear flag pattern, often a temporary lull before the next storm. In addition, true market bottoms are often accompanied with capitulation volume spikes followed by volume increases as prices march higher. While there was an impressive spike for the building (residential/commercial) index's most recent bottom during the week of July 14, increasing volume as the index moves higher has yet to materialize. True to form for a bear flag, volume has instead steadily declined over the pattern. As an industry, homebuilders are in no danger of disappearing, but some companies will as the economy cools. Until there is evidence that the worst is truly over, namely that increasing stock prices among homebuilders are accompanied by rising growth, GPE, and earnings rates, trying to pick a bottom could be detrimental to your financial (and emotional) health. Looking at the larger picture, there is a more important question. What impact will the ongoing housing market meltdown have on the economy and markets in 2007-08? |
Matt Blackman is a full-time technical and financial writer and trader. He produces corporate and financial newsletters, and assists clients in getting published in the mainstream media. He tweets about stocks he is watching at www.twitter.com/RatioTrade Matt has earned the Chartered Market Technician (CMT) designation.
| E-mail address: | indextradermb@gmail.com |
PRINT THIS ARTICLE

Request Information From Our Sponsors
- VectorVest, Inc.
- Executive Premier Workshop
- One-Day Options Course
- OptionsPro
- Retirement Income Workshop
- Sure-Fire Trading Systems (VectorVest, Inc.)
- Trading as a Business Workshop
- VectorVest 7 EOD
- VectorVest 7 RealTime/IntraDay
- VectorVest AutoTester
- VectorVest Educational Services
- VectorVest OnLine
- VectorVest Options Analyzer
- VectorVest ProGraphics v6.0
- VectorVest ProTrader 7
- VectorVest RealTime Derby Tool
- VectorVest Simulator
- VectorVest Variator
- VectorVest Watchdog
- StockCharts.com, Inc.
- Candle Patterns
- Candlestick Charting Explained
- Intermarket Technical Analysis
- John Murphy on Chart Analysis
- John Murphy's Chart Pattern Recognition
- John Murphy's Market Message
- MurphyExplainsMarketAnalysis-Intermarket Analysis
- MurphyExplainsMarketAnalysis-Visual Analysis
- StockCharts.com
- Technical Analysis of the Financial Markets
- The Visual Investor

