HOT TOPICS LIST
- Strategies
- Stocks
- Buy
- Investing
- Brokers
- Psychology
- Interviews
- Accumulate
- Sell
- Hold
- Spotlight
- Websites
- Candlestick Corner
- Gold & Metals
- Options Trading
LIST OF TOPICS
THE OPTIMIZED TRADER
Trading The MACD Histogram, Part II
12/29/06 03:44:33 PM PSTby David Penn
Here's a look at trading histogram divergences and crosses of the zero line, targeting specific entries, and examining exit strategies.
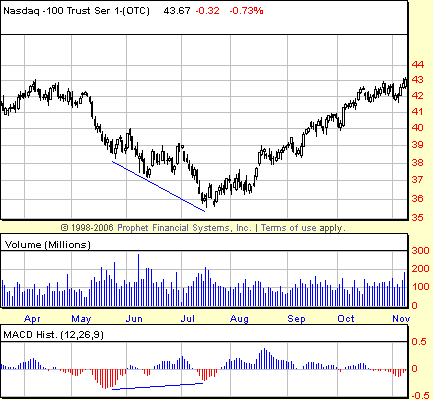
| Any trader who likes the idea of getting into a move early probably has a cherished spot in his or her heart for divergences. While some other methods work well for spotting tops and bottoms of trends (for instance, Victor Sperandeo's 2B method, also known as the "Turtle Soup setup," as introduced by trader Larry Connor), most traders rely on divergences between markets and oscillators like the stochastic, the relative strength index (RSI), and the moving average convergence/divergence (MACD) to catch the imbalance that occurs when markets make new extremes and oscillators refuse to confirm them. DIVERGENCES AND ZERO LINES The divergences using the histogram can be even easier to spot than in those indicators and oscillators that use single lines to indicate values. Spotting peaks and troughs among a set of vertical bars (as in the case with histograms) tends to reduce the sizing-up that can occur with the stochastic or the RSI, as well as eliminate that annoyance of trying to determine if a peak in an indicator was actually made. While numerical indicator values definitely makes it easier for a trader to be decisive with regard to the different levels, the clarity of the histogram bars makes the indicator that much easier and quicker to consult on a regular basis. See Figure 1.
|
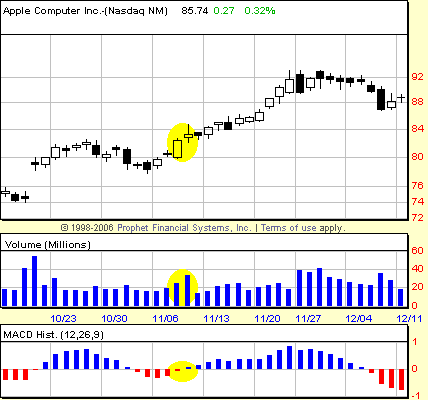
| A divergence in the MACD histogram looks just like one with any other indicator or oscillator: the market makes a high (or low) and then goes on to make a further extreme, while the indicator registers either a lower high in the case of a negative divergence or a higher low in the case of a positive divergence. In order to set up the trigger session, I rely on a change in slope on the second peak or trough in the histogram. In the case of a positive divergence following a downtrend, the pattern representing the change in slope would resemble "P-p-P" on the second, shorter peak, with the second "P" representing the trigger session above which to go long. With regard to a negative divergence following an uptrend, a pattern resembling "m-M-m" would produce a trigger session with the second "m" -- below which to go short. Although it was not something I traded with much frequency, histogram crosses above and below the zero line (that is, when the histogram switches from positive to negative or vice versa) can also provide powerful signals for traders. While histograms above the zero line are more likely to be overbought (and thus sold) and those under the zero line are more likely to be oversold (and thus bought), there is plenty of room between the time the zero line is crossed and a market becomes so overbought or oversold that a change in trend -- or at least a correction -- becomes necessary. And it is in this area that traders looking to buy a histogram that is moving from negative to positive or sell a histogram that is moving from positive to negative that this particular zero line method operates. HE HAPPY HISTOGRAM
|
| Another small feature that I use with the MACDH trading method is the 50-day exponential moving average (EMA). Every trader has his or her preferred moving average duration and type, and I feel comfortable using the 50-day EMA as a bull/bear line in the sand. By that I mean a histogram buy signal is only valid if it occurs above the 50-day EMA on a closing basis. The session can open below the 50-day EMA, but by the close it must be above that level. Otherwise, the buy signal is ignored. At the same time, I only act on histogram short signals that occur below the 50-day EMA. As you might imagine, the exception to this rule is when dealing with divergences which, almost by definition, will have traders buying below the 50-day EMA and selling above the 50-day EMA. One last note: The sort of exits most appropriate with MACD histogram trading depend more on the sort of trading, particularly in terms of duration. Although the MACD histogram is a good, all-around entry signal creator, I initially liked the approach as a swing trading tool. This meant relying on shorter-term exit strategies like trailing stops or specific "two up or three down" money management (that is, look to gain two points or lose no more than three). Oliver Velez of Pristine.com has a trade management approach that I've also found helpful. In his book Tools And Tactics For The Master Day Trader, Velez encourages traders to move stops to breakeven once the trade has gained $1, and then employ trailing and time stops. For divergence trades where a little more leeway is a good thing, chandelier stops may be a good option. |
| SUGGESTED READING Achelis, Steven B. [1995]. Technical Analysis From A To Z, Irwin Professional Publishing. Elder, Alexander [1993]. Trading For A Living, John Wiley & Sons. Gifford, Elli [1995]. The Investor's Guide To Technical Analysis, Financial Times/Pitman Publishing. Horner, Raghee [2005]. Forex Trading For Maximum Profit, John Wiley & Sons. Kahn, Michael [2006]. Technical Analysis: Plain And Simple, Financial Times/Pitman Publishing. Murphy, John J. 1996]. The Visual Investor, John Wiley & Sons. Velez, Oliver [2000]. Tools And Tactics For the Master Day Trader, McGraw-Hill. |
Technical Writer for Technical Analysis of STOCKS & COMMODITIES magazine, Working-Money.com, and Traders.com Advantage.
| Title: | Traders.com Technical Writer |
| Company: | Technical Analysis, Inc. |
| Address: | 4757 California Avenue SW |
| Seattle, WA 98116 | |
| Phone # for sales: | 206 938 0570 |
| Fax: | 206 938 1307 |
| Website: | www.traders.com |
| E-mail address: | DPenn@traders.com |
Traders' Resource Links | |
| Charting the Stock Market: The Wyckoff Method -- Books | |
| Working-Money.com -- Online Trading Services | |
| Traders.com Advantage -- Online Trading Services | |
| Technical Analysis of Stocks & Commodities -- Publications and Newsletters | |
| Working Money, at Working-Money.com -- Publications and Newsletters | |
| Traders.com Advantage -- Publications and Newsletters | |
| Professional Traders Starter Kit -- Software | |
PRINT THIS ARTICLE

|

Request Information From Our Sponsors
- StockCharts.com, Inc.
- Candle Patterns
- Candlestick Charting Explained
- Intermarket Technical Analysis
- John Murphy on Chart Analysis
- John Murphy's Chart Pattern Recognition
- John Murphy's Market Message
- MurphyExplainsMarketAnalysis-Intermarket Analysis
- MurphyExplainsMarketAnalysis-Visual Analysis
- StockCharts.com
- Technical Analysis of the Financial Markets
- The Visual Investor
- VectorVest, Inc.
- Executive Premier Workshop
- One-Day Options Course
- OptionsPro
- Retirement Income Workshop
- Sure-Fire Trading Systems (VectorVest, Inc.)
- Trading as a Business Workshop
- VectorVest 7 EOD
- VectorVest 7 RealTime/IntraDay
- VectorVest AutoTester
- VectorVest Educational Services
- VectorVest OnLine
- VectorVest Options Analyzer
- VectorVest ProGraphics v6.0
- VectorVest ProTrader 7
- VectorVest RealTime Derby Tool
- VectorVest Simulator
- VectorVest Variator
- VectorVest Watchdog


