HOT TOPICS LIST
- Strategies
- Stocks
- Buy
- Investing
- Brokers
- Psychology
- Interviews
- Accumulate
- Sell
- Hold
- Spotlight
- Websites
- Candlestick Corner
- Gold & Metals
- Options Trading
LIST OF TOPICS
THE OPTIMIZED TRADER
Breakouts, Pullbacks, And Gaming The 2B
01/24/07 11:52:52 AM PSTby David Penn
Another mild post-breakout pullback for the Philadelphia Semiconductor Index provides an opportunity to see 2B tops in action as short-term countertrend plays.
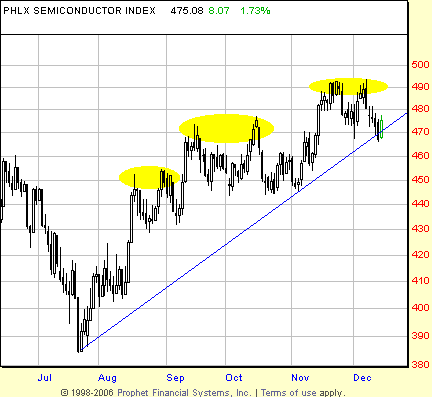
| Few things in a trader's life are more annoying than a failed breakout. The phenomenon of the failed breakout is so prevalent that a number of trading setups, such as Victor Sperandeo's 2B test and Larry Connor's Turtle Soup, have been developed to take advantage of the inability of markets to follow through after breaking out (or down) beyond a previous price extreme. While some of these setups will have traders catching major reversals in trend, at a minimum they serve as warning signs that the current trend is in doubt and that profit-taking may be a prudent next move. Writing about the 2B test in his book, Trader Vic: Principles Of Professional Speculation, Victor Sperandeo notes of what he has come to call the "2B Indicator": In an uptrend, if prices penetrate the previous high, fail to carry through, and then immediately drop below the previous high, then the trend is apt to reverse. The converse is true for downtrends. Looking at how time factors into the 2B trade (I can't bring myself to call it an "indicator") as Sperandeo describes it encouraged me to consider another aspect of this setup: How long after entry should a trader expect to be profitable if, in fact, the 2B has caught a true change in trend. While later Sperandeo suggests that "even if you get whipped out two, three or even four consecutive times, the one you catch will end up making you a bundle," that would not necessarily have been the case with the trader trying to sell 2B tops against the semiconductor index from July 2006 through December. Rather, it appears that the trader willing to take short-term, countertrend plays against the $SOX rally could have done fairly well -- if he or she had an idea of how long to let the 2B play out before the uptrend was restored and the short play stopped out (or, worse, exited at a loss).
|
| Of the five breakouts that moved the Philadelphia Semiconductor Index higher from mid-July to mid-December, three of those breakouts were -- technically speaking -- failed breakouts. By this I mean that after breaking out above a previous high, the market retreated below the low of the previous high. This is opposed to the sort of breakout I wrote about years ago, one I called the DLB breakout, which stood for "don't look back." Such breakouts not only cleared the previous high, but also never traded below that previous high once the breakout was complete. (See my Working-Money.com piece "Building A Better Breakout," from July 1, 2003, for more on DLB breakouts.) In all three of those failed breakouts, traders would have been provided sell signals based on the 2B and Turtle Soup methodologies. And while none of those sell signals would have correctly anticipated a reversal in trend, all three would have given fair warning for traders who were long semiconductor stocks to take profits, or for short-term, hourly chart traders to make a little money, perhaps with carefully placed two- or three-day short plays.
|
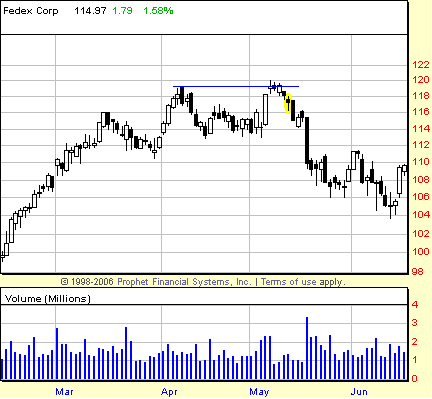
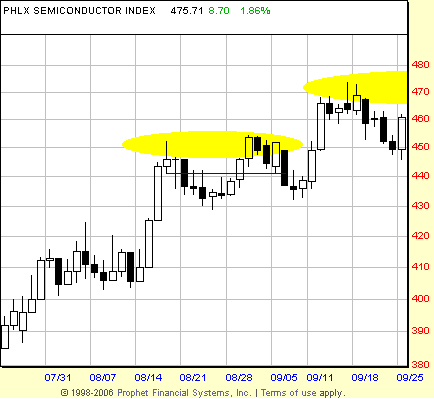
| In my quest to figure out how long you give 2B plays before deciding that they are marking a correction rather than a reversal, I have developed a rule of thumb. That rule that I have been keeping in the back of my mind is that you want to take profits from a 2B (or Turtle Soup) trade within half the amount of time it took for the 2B to set up. If there are 10 days between the two highs of a 2B test of top, then I want to have taken profits by the fifth day after the later high. See Figure 2. Consider the three 2B tests in Figure 1 -- and recall that the $SOX is tradable as an option play, even if there is no way to trade the $SOX outright (SMH, the HOLDRS exchange traded fund, would be one alternative). In the first instance, there are two highs, August 17 and August 30, that make up the 2B test of top. There are 10 trading days between them. Entering short at 441.15 -- the low of the initial high -- on September 5, we find that by the fifth day after the second high -- September 7 -- the $SOX is closing at 435.58. That ends up being the low close of the correction, as the $SOX reverses shortly afterward and begins moving up again.
|
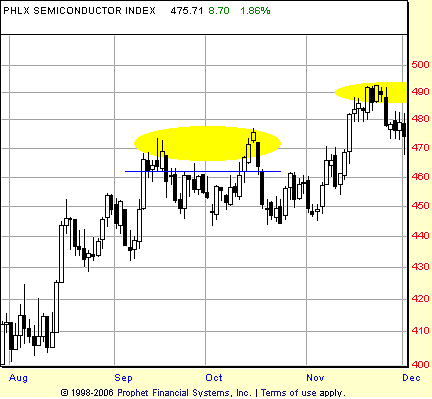
| The next failed breakout arrived in mid-September. With peaks on September 15 and October 13, there were 20 trading days in between. This means that a trader going short on a 2B test would be looking to take profits on or before the 10th day after the second high. Entering short at 462.38 -- again, the low of the initial high -- we find ourselves at the 10th day on October 27 with a close of 452.28. That wasn't the lowest close of the 10-day period; there were lower closes earlier (ironically, near the fifth day), but such a trade would have represented a 10-point move. If we consider the $SOX as an option play, then that move would have been a two-strike play (the 460 and 455 strikes would have been hit on the way down). The August play would have been somewhat less profitable from this perspective insofar as only the 440 strike would have been definitively exceeded. See Figure 3.
|
| The most recent failed breakout in the $SOX created another relatively short-term, 10-day 2B from the initial high on November 22 to the subsequent higher high on December 7. With a 10-day duration, a 2B trader using this approach would want to be out of the trade -- or, at least, with partial profits taken and a stop (mental or otherwise) moved to breakeven -- on or before the fifth day after the second high. In this instance, the short signal would have arrived on December 7 at 486.12 when the $SOX crossed below the low of the initial high. Five days later, the $SOX had fallen to as low as the close on the fourth day (467.01) -- a four-strike move. To put some numbers on that trade, consider the December $SOX puts in early December. The fact that the trade has a five-day time limit means that the December options were a safe vehicle. As of the close on December 7, the December 485 $SOX puts were trading at $8.20. By the fourth day (December 13), those same puts were trading more than 100% higher, closing that day at $17.70. See Figure 4. An approach like this that lets traders take advantage of short-term tops but allows for the possibility of those short-term tops becoming more long-lasting is a worthwhile strategy to consider. While Sperandeo insists that, sooner or later, a lasting 2B top will arrive, this method of tempering expectations somewhat and looking to lock in whatever gains the market provides is ideal for countertrend bets that, inevitably, will prove to be losing propositions from time to time. This approach is also suitable for trading around a position such as a longer-term bullish stance, which (using the semiconductors as an example) might have been adopted shortly after the July bottom. SUGGESTED READING |
Technical Writer for Technical Analysis of STOCKS & COMMODITIES magazine, Working-Money.com, and Traders.com Advantage.
| Title: | Traders.com Technical Writer |
| Company: | Technical Analysis, Inc. |
| Address: | 4757 California Avenue SW |
| Seattle, WA 98116 | |
| Phone # for sales: | 206 938 0570 |
| Fax: | 206 938 1307 |
| Website: | www.traders.com |
| E-mail address: | DPenn@traders.com |
Traders' Resource Links | |
| Charting the Stock Market: The Wyckoff Method -- Books | |
| Working-Money.com -- Online Trading Services | |
| Traders.com Advantage -- Online Trading Services | |
| Technical Analysis of Stocks & Commodities -- Publications and Newsletters | |
| Working Money, at Working-Money.com -- Publications and Newsletters | |
| Traders.com Advantage -- Publications and Newsletters | |
| Professional Traders Starter Kit -- Software | |
PRINT THIS ARTICLE

Request Information From Our Sponsors
- VectorVest, Inc.
- Executive Premier Workshop
- One-Day Options Course
- OptionsPro
- Retirement Income Workshop
- Sure-Fire Trading Systems (VectorVest, Inc.)
- Trading as a Business Workshop
- VectorVest 7 EOD
- VectorVest 7 RealTime/IntraDay
- VectorVest AutoTester
- VectorVest Educational Services
- VectorVest OnLine
- VectorVest Options Analyzer
- VectorVest ProGraphics v6.0
- VectorVest ProTrader 7
- VectorVest RealTime Derby Tool
- VectorVest Simulator
- VectorVest Variator
- VectorVest Watchdog
- StockCharts.com, Inc.
- Candle Patterns
- Candlestick Charting Explained
- Intermarket Technical Analysis
- John Murphy on Chart Analysis
- John Murphy's Chart Pattern Recognition
- John Murphy's Market Message
- MurphyExplainsMarketAnalysis-Intermarket Analysis
- MurphyExplainsMarketAnalysis-Visual Analysis
- StockCharts.com
- Technical Analysis of the Financial Markets
- The Visual Investor


