HOT TOPICS LIST
- Strategies
- Stocks
- Buy
- Investing
- Brokers
- Psychology
- Interviews
- Accumulate
- Sell
- Hold
- Spotlight
- Websites
- Candlestick Corner
- Gold & Metals
- Options Trading
LIST OF TOPICS
FOCUS ON
Charting Cramer: GS And MO
02/02/07 04:24:12 PM PSTby David Penn
Rounding out Cramer's value picks for 2007 are a big-name investment banking firm and an even bigger-name blue chip.
| In my first installment of "Charting Cramer" (Working-Money.com, January 10, 2007), I looked at Halliburton, also known as "King Hal" by its admirers. At the time, Halliburton had made it into Jim Cramer's "Top Three Value Stocks for '07" list, along with Goldman Sachs and Altria Group (previously known as Philip Morris). I suggested that in the wake of Halliburton's impressive bull market run from under 15 in late 2004 to more than 40 by spring 2006, a correction of some magnitude was in order. Further, with Halliburton trading at the time just under 30, I noted that the weekly chart of the stock suggested that a short-term top had been established early in December at the 34 level, and that the stock was likely to correct to the 26–27 level before becoming attractive to buyers. Since I wrote that article, Halliburton traded as low as 28 on an intraday basis and has since bounced up into moving average resistance. On the weekly chart, while Halliburton is displaying the sort of tails that often signify decreasing momentum on the downside, the moving average convergence/divergence (MACD) histogram continues to record lower and lower levels. Until that situation changes and the MACD histogram begins making higher lows (in the event it remains oversold) or higher highs, Halliburton remains vulnerable to moving lower. In this follow-up to my first "Charting Cramer" article, I wanted to analyze the other two stocks in Jim Cramer's Top Value Stocks of '07 cohort, Goldman Sachs and Altria Group. Both stocks, along with Halliburton, have long been favorites of Jim Cramer, who often holds to a "best of breed" approach when trying to decide which stocks to stick with and which stocks to abandon at the first sign of troubling news. Goldman Sachs is a major investment banker known for making a sizable chunk of its change through its own proprietary trading. Altria Group is the corporation formerly known as Philip Morris, and one of the largest food, beverage, and tobacco companies in the world. Cramer says that these are the kind of stocks you can hold in good times and "back up the truck" and acquire when the rest of the world seems to be going to hell in a handbasket. He likes the fundamentals. But how do the technicals hold up? GOOD AS GOLDMAN?
|
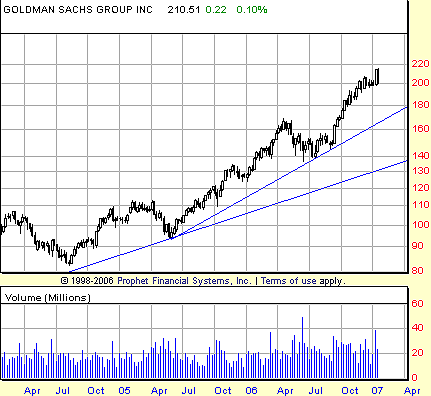
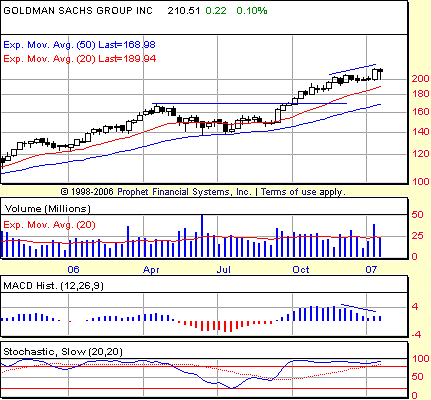
| The last correction in Goldman Sachs was in the middle of 2006 (Figure 1). Goldman peaked out just shy of 170 in the spring and spent the remainder of that quarter and most of the next in correction mode, falling below 140 on an intraweek basis twice before bottoming in the summer. Since then, Goldman has rallied to take out the old high near 170 and, after a struggle, managed to breach the 200 level late in the year (Figure 2). Now, 2007 has found Goldman moving strongly — perhaps too strongly — toward the 220 level.
|
| The weekly MACD histogram gave a buy signal in Goldman Sachs as of the week ended January 12. For that buy signal to be confirmed, Goldman will have to have a weekly close above the high of the week ended January 12, or 214.22. This buy opportunity comes on the heels of the relatively short consolidation in the stock that began in mid- to late November 2006 and from which Goldman has only recently broken free. Traders and investors intent on buying Goldman Sachs at this point could use that consolidation as a source of major support. Depending on individual trading and investing goals, the stock's potential to fall back into or below the consolidation range would be sufficient cause for concern, if not an outright exit. Other causes for concern? For the new investor, the greatest cause for concern in Goldman may be the fact that the best time to buy the stock was back in the summer. Since then, the stock has become increasingly extended to the upside. With a most recent weekly close at about 210, Goldman Sachs is 20-odd points above its 20-week exponential moving average (EMA) and 40-odd points above its 50-week EMA. As such, Goldman Sachs appears more and more ready for a correction, if only to let the moving averages catch up with the price action. There is also a growing negative divergence in Goldman Sachs' MACD histogram in the weekly chart that could develop into an actual sell signal if the stock broke down below the low of its late November–December consolidation range (that is, any daily print below 200 would do it). I don't offer that as a short suggestion; I would simply point out that a decline below 200 would trigger a sell in the weekly MACD histogram. Likely points of support in the event of a correction in Goldman Sachs include not only the 20-week EMA at 195, but perhaps more important the 170 level that coincides with both the current level of the 50-week EMA, as well as the breakout level from early October. A correction to 170 would also represent approximately a 61.8% Fibonacci retracement from current highs. THE BIG MO On February 1, more than a week after this article was originally written, Altria Group announced that it would spin off Kraft Foods, distributing 89% of Kraft's outstanding shares owned by Altria to Altria's shareholders of record as of March 29. The distributed is scheduled for March 30 according to The Wall Street Journal, and is believed to be part of a broader plan that includes, for example, splitting Altria's US tobacco operations from its international tobacco business.
|
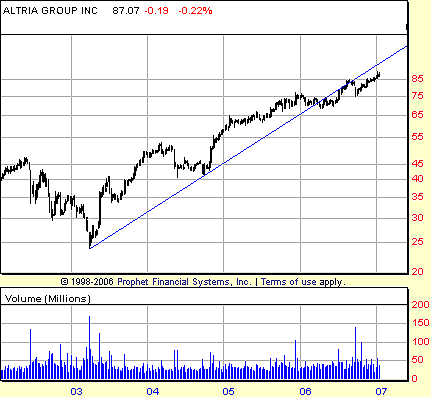
| How have the past few years treated Altria Group? In many ways, Altria has fared as well as Cramer's other value stocks for 2007 — namely, Halliburton and Goldman Sachs. Since bottoming in the spring of 2003 near 25, Altria Group doubled by the first quarter of 2004 and tripled by the end of the fourth quarter of 2005. There have been two bear markets of consequence in the stock since the 2003 bottom: a drop from the low 50s to the low 40s during the bear market of 2004, and a milder bear market from late 2005 until the early summer of 2006. A funny thing happened on the way to that triple at 75. Altria Group slipped below a long-term trendline that it had last used for support at the end of the 2004 bear market. The rally that sprung from this test of trendline support was the rally that took the stock from the low 40s to the high 80s by early 2007. But that trendline was broken during the correction of the first half of 2006. Not only was the trendline broken, but since slipping beneath the trendline, Altria Group has remained below an upward extension of the trendline. The trendline that was once a measure of support increasingly appears to have become a trendline of resistance.
|
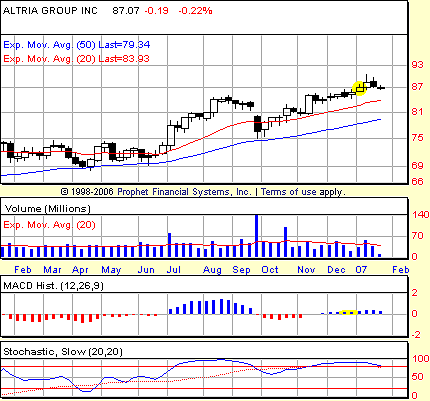
| This development should not be construed as a failure for Altria Group. The trend in the stock is still upward. And from other reasonable vantage points — such as the end of the 2006 bear market — Altria is actually extended above an intermediate-term trendline (last weekly close at about 87, with the 20-week EMA above 83). Altria last gave a weekly buy signal at the end of the week ended Friday, December 29, a buy signal that was confirmed by a higher weekly close the following week (at 87.15, for the week ended Friday, January 5). As of this writing, that confirmed buy signal remains intact. There were other previous weekly buy signals in MO that would have gotten speculators on board sooner: the best of these signals came at the end of the week ended October 27 (confirmed the week ended November 17 at 85). But as long as the stock continues to provide buy signals and those buy signals are confirmed by follow-through in the form of a higher weekly close, speculators have every reason to expect that the stock has not yet run out of upside. Are there warning signs in Altria that speculators should be aware of? The current rally in MO is accompanied by less than overwhelming volume, as Figure 4 shows. In fact, while Altria has clearly broken out above its August highs, a part of me looks at the stock since September and almost sees an upwardly tilted cup with handle pattern. Regardless, that mental "pattern-making" may just be my way of telling myself that Altria needs a big move higher — preferably with a close near the weekly high for a change — in order to make believers of the speculators who sat and watched the November breakout rather than trade it. I could argue that a negative divergence has formed between the August and January, higher high price highs and the August and January, lower-high MACD histogram highs. But that seems to entail giving the January peak more credit for being a peak than it deserves. A breakdown from current levels also does not seem especially likely in the immediate term — in large part because of the abundance of support from the August–September consolidation, the 20-week EMA, and even the sluggish price action in November and December. V IS FOR VALUE Taken as a group, Halliburton, Goldman Sachs, and Altria Group certainly represent the sort of companies that average investors can feel comfortable investing in and speculators can feel comfortable trading. They are "big American companies," as the saying goes, that are not likely to disappear overnight. Again, when Cramer refers to these stocks as "value" stocks, he is not doing so in the same way that a beaten-up, sub-$10 stock might be considered a "value" play. As the charts in this and my previous article showed, there is little that is "beaten-up" about Halliburton, Goldman Sachs, and Altria. Rather, these stocks are value stocks in the sense that they are likely to perform well when the market is doing well and likely to represent great buying opportunities when the market is not doing so well and is doing its diabolical best to drag otherwise "best of breed" companies with it. What this technical take seeks to do is to pinpoint just when these value stocks have started to earn back their appreciation from the big buyers in the marketplace and provide a heads-up to those traders and investors who may be considering these plays and lack only a clear signal as to the best time to strike. SUGGESTED READING |
Technical Writer for Technical Analysis of STOCKS & COMMODITIES magazine, Working-Money.com, and Traders.com Advantage.
| Title: | Traders.com Technical Writer |
| Company: | Technical Analysis, Inc. |
| Address: | 4757 California Avenue SW |
| Seattle, WA 98116 | |
| Phone # for sales: | 206 938 0570 |
| Fax: | 206 938 1307 |
| Website: | www.traders.com |
| E-mail address: | DPenn@traders.com |
Traders' Resource Links | |
| Charting the Stock Market: The Wyckoff Method -- Books | |
| Working-Money.com -- Online Trading Services | |
| Traders.com Advantage -- Online Trading Services | |
| Technical Analysis of Stocks & Commodities -- Publications and Newsletters | |
| Working Money, at Working-Money.com -- Publications and Newsletters | |
| Traders.com Advantage -- Publications and Newsletters | |
| Professional Traders Starter Kit -- Software | |
PRINT THIS ARTICLE

Request Information From Our Sponsors
- StockCharts.com, Inc.
- Candle Patterns
- Candlestick Charting Explained
- Intermarket Technical Analysis
- John Murphy on Chart Analysis
- John Murphy's Chart Pattern Recognition
- John Murphy's Market Message
- MurphyExplainsMarketAnalysis-Intermarket Analysis
- MurphyExplainsMarketAnalysis-Visual Analysis
- StockCharts.com
- Technical Analysis of the Financial Markets
- The Visual Investor
- VectorVest, Inc.
- Executive Premier Workshop
- One-Day Options Course
- OptionsPro
- Retirement Income Workshop
- Sure-Fire Trading Systems (VectorVest, Inc.)
- Trading as a Business Workshop
- VectorVest 7 EOD
- VectorVest 7 RealTime/IntraDay
- VectorVest AutoTester
- VectorVest Educational Services
- VectorVest OnLine
- VectorVest Options Analyzer
- VectorVest ProGraphics v6.0
- VectorVest ProTrader 7
- VectorVest RealTime Derby Tool
- VectorVest Simulator
- VectorVest Variator
- VectorVest Watchdog


