HOT TOPICS LIST
- Strategies
- Stocks
- Buy
- Investing
- Brokers
- Psychology
- Interviews
- Accumulate
- Sell
- Hold
- Spotlight
- Websites
- Candlestick Corner
- Gold & Metals
- Options Trading
LIST OF TOPICS
FINANCIAL PLANNING
Chart The Market, Control Your Future (II)
01/26/01 11:02:47 AM PSTby Dennis D. Peterson
With a few charts and this simple technique, you can manage your 401(k).
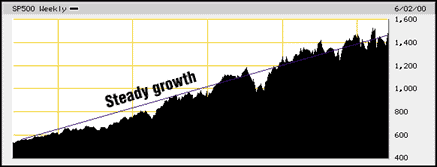
401(k) plans are an investment boon to working people. However, simply contributing to your 401(k) without actively managing the account may not guarantee the above-average returns over time that most investors have come to expect. If you have a few funds to choose from in your 401(k), you may be able to improve your returns by shifting your 401(k) investment into a better-performing mutual fund. How do you move your money and when is the time right to do so? The answer is simpler than you think: Learn how to read stock charts and how to follow and profit from trends in the stock market. TRENDS AND TRIANGLES When it comes to investing, there are two schools of thought: fundamental analysis and technical analysis. Fundamentalists study the earnings of a company and expectations of increased earnings over the coming months and years. They can argue that a stock or fund should go up because the fundamentals are good, and in all probability, within five years the stock or fund is most likely to go up. Technical analysts, on the other hand, rely on stock price charts to make investment decisions. Trendlines, triangles, and other patterns provide information on the best time to buy or sell a stock. For market timing decisions, these tools are indispensable. Charts are a history of price action over time. They show the forces of supply and demand at work. When demand is greater than supply, prices rise. Conversely, when supply is greater than demand, prices fall. Charts help you understand how supply and demand interact. When you see a distinct rise or fall in prices, you can say with confidence that a trend is forming. The weekly chart of the Standard & Poor's 500 index over the last five years in Figure 1 shows a steady upward trend. When you notice such a pattern developing, it is helpful to draw trendlines. A trendline is a straight line connecting a series of price peaks during downtrends or valleys during uptrends.
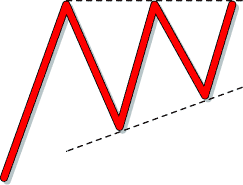
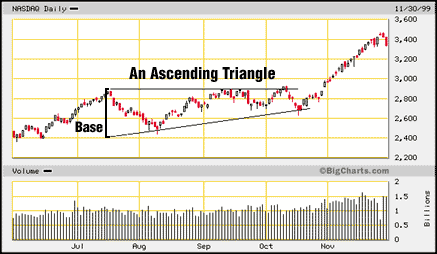
Trendlines help you recognize formations or patterns with a highly predictive outcome. Once you start connecting the peaks and valleys, you will start to see other patterns developing. One such pattern is the ascending triangle (Figures 2 and 3). A relatively flat line connects the tops of the Nasdaq Composite, while an ascending line connects the valleys.
The base of the triangle in Figure 3 stretches from 2400 to 2900, a difference of 500. If you add 500 to 2900 -- the top of the triangle -- you get 3400, at which point you can predict a change. As it turns out, the Nasdaq did advance to and stumble at 3400, almost as if on cue. What happened here was that sellers started to catch up with buyers. How do you recognize this shift from buyers to sellers? You need to look at another indicator, the Nasdaq trading volume, which is the total number of shares being traded on the Nasdaq on a daily basis. During the Nasdaq Composite's rise, the volume was much higher than during the previous months. This suggests that there were a lot of buyers during the rise, and most were buying because the price was going up. Since most people want to maximize their profit, as more people hopped onto the rising Nasdaq bandwagon, earlier holders didn't want to sell right away. Those who were in at 2900 weren't selling during this period, and those who got in later had even less reason to sell. The first sign of higher selling than buying was at 3400, but there were still buyers. For a brief period, there was a minor consolidation where buyers and sellers were evenly matched, after which the Nasdaq went even higher. Unfortunately, it was on lower volume, and it wasn't long before you felt the consequences: the price dropped. The moral of this story? First, there is predictability in patterns; and second, volume speaks volumes. What does all this mean for your 401(k)? It means that if you notice an upward trending sector and your 401(k) offers a fund within that sector, you can switch your money into that fund and enjoy the ride up. When do you get cautious again? Again, the charts will tell you. Generally, fundamental analysis is encouraged when it comes to investing for the long term. But if you want to try your hand at technical analysis for investments such as your 401(k) plan, you may want to start with a small portion of your account -- say, 5% to 10%. As a trend or pattern develops that appears to be bullish, put the entire 5-10% into the stock or fund of your choice. If a bearish pattern develops, put it back into a safe haven like a money market account. If you think a bullish pattern may be ending, put just a portion of the 5-10% into the market. When a sector goes through a bullish upturn, it is very likely that funds associated with that specific sector will do well. For example, when the Nasdaq Composite rises, most technology funds do well. Some funds will even outperform their related sector. These funds gain a greater percentage than their corresponding index and lose less when the market makes small corrections. However, their performance isn't necessarily going to be consistent. Fund managers are continually changing their mix of stocks, so performance can and does change. Some funds are highly volatile because of the mix. MANAGING RISK The prudent 401(k) investor monitors his or her portfolio, keeps an eye out for changes, and adjusts his or her strategy accordingly. During times of increased market volatility, moving to a fund that is less volatile can reduce risk. The tradeoff is less profit, for the sake of capital preservation. The most I invest on any given day is 80% of my entire account, but often I will only invest 40%. When I suspect a downturn is about to occur, I don't invest anything. Can technical analysis work for you? I have successfully predicted whether the Nasdaq will finish up or down the next day 80% of the time. For three weeks running I was right every day, so I know it can work. But what if you're wrong some of the time? Do some research. Keep a diary, and every time you are wrong, find out why. Was there some piece of information that could have helped? Finally, don't be hard on yourself when you do make a mistake. Soon, you will find out how to make the money back. It's not rocket science; it's just technical analysis.
|
Market index trading on a daily basis.
| Title: | Staff Writer |
| Company: | Technical Analysis, Inc. |
| Address: | 4757 California Ave SW |
| Seattle, WA 98116-4499 | |
| Phone # for sales: | 206 938 0570 |
| Fax: | 206 938 1307 |
| Website: | working-money.com |
| E-mail address: | dpeterson@traders.com |
Traders' Resource Links | |
| Charting the Stock Market: The Wyckoff Method -- Books | |
| Working-Money.com -- Online Trading Services | |
| Traders.com Advantage -- Online Trading Services | |
| Technical Analysis of Stocks & Commodities -- Publications and Newsletters | |
| Working Money, at Working-Money.com -- Publications and Newsletters | |
| Traders.com Advantage -- Publications and Newsletters | |
| Professional Traders Starter Kit -- Software | |
PRINT THIS ARTICLE

Request Information From Our Sponsors
- StockCharts.com, Inc.
- Candle Patterns
- Candlestick Charting Explained
- Intermarket Technical Analysis
- John Murphy on Chart Analysis
- John Murphy's Chart Pattern Recognition
- John Murphy's Market Message
- MurphyExplainsMarketAnalysis-Intermarket Analysis
- MurphyExplainsMarketAnalysis-Visual Analysis
- StockCharts.com
- Technical Analysis of the Financial Markets
- The Visual Investor
- VectorVest, Inc.
- Executive Premier Workshop
- One-Day Options Course
- OptionsPro
- Retirement Income Workshop
- Sure-Fire Trading Systems (VectorVest, Inc.)
- Trading as a Business Workshop
- VectorVest 7 EOD
- VectorVest 7 RealTime/IntraDay
- VectorVest AutoTester
- VectorVest Educational Services
- VectorVest OnLine
- VectorVest Options Analyzer
- VectorVest ProGraphics v6.0
- VectorVest ProTrader 7
- VectorVest RealTime Derby Tool
- VectorVest Simulator
- VectorVest Variator
- VectorVest Watchdog


