HOT TOPICS LIST
- Strategies
- Stocks
- Buy
- Investing
- Brokers
- Psychology
- Interviews
- Accumulate
- Sell
- Hold
- Spotlight
- Websites
- Candlestick Corner
- Gold & Metals
- Options Trading
LIST OF TOPICS
MARKET UPDATE
Fifth Of A Fifth?
02/28/07 12:34:10 PM PSTby David Penn
Has the S&P 500 just begun its last surge higher?
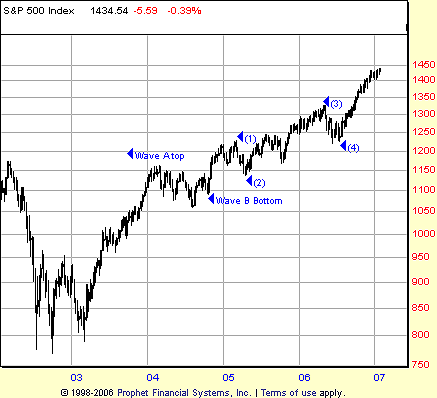
| My last Elliott wave count was published for Traders.com Advantage ("Wave Count Update," September 22, 2006). That wave count suggested two things then that bear amendment today. The first was that the Standard & Poor's 500 had topped (a wave 3 top) in mid-September. The second was that, based in part on this wave 3 top, the Standard & Poor's 500 was likely to make a wave 5 top between 1377 and 1390. I was wrong in both instances. The bull market from mid-July through the December high saw the S&P 500 climb from 1220 to over 1420, making both the wave 3 peak and the wave 5 peak calls invalid. Where does that leave us? There are two sets of waves worth analyzing. The first set is the set of five waves emanating from what I still believe was a wave B low in the second half of 2004. The second set of waves is the one that has sprung from what I believe was a wave 4 low in the summer of 2006. Figure 1 shows the entirety of the cyclical bull market, including what I believe to be the third and final C wave of this move that began in late 2002. This bull market, as I have written, is a three-segmented phenomenon, with a sharp A wave from October 2002 until March 2004 and a jagged, complex B wave from April 2004 until October 2004. The A wave of this cyclical bull market was wholly the creation of expansionist monetary and fiscal policy, the "tough get going" euphoria of the early months of the US–led invasion of Iraq and what appeared to be the utter political dominance of the incumbent party, the Republicans.
|
| The B wave, again from March until October 2004, was a corrective to the previous A wave. The B wave was also as complex a wave structure as the A wave was simple. While your Elliott wave mileage may vary, I have posited that the B wave ended not at the price low point of 1060 in August 2004, but instead ended a few months later in October with a low that was closer to 1100. Part of my inspiration (for lack of a better word) for this decision was the 1982 bear market that more accurately marked the end of the secular bear market that began in 1966 than did the actual low point of that secular bear market (which was in 1974). Interestingly enough, on an inflation-adjusted level, the actual low point of that secular bear market was in fact in the early 1980s. The B wave was characterized by increasing popular discontent over the progress of the invasion/war/occupation of Iraq. It is worth recalling the tenor of the times in early 2004. Saddam Hussein was captured in December 2003. President Bush joked about not finding "weapons of mass destruction" to a tickled audience at a Radio and Television Correspondents dinner in March 2004. But the shift in social mood was on the way. The Abu Ghraib scandal broke a month later. A month after that, in May, people around the world were shocked to witness the videotaped beheading of Nicholas Berg, an American contractor working in Iraq who had been kidnapped by something increasingly referred to as "the Iraqi insurgency." By August, the opposition political party had nominated a man who had voted in favor of the Iraq invasion but had since become harshly critical. It was particularly fitting that the Democratic Presidential nomination convention occurred in the same month as the price low of the 2004 bear market in August. A month later, President Bush would refer to the invasion and occupation of Iraq as "catastrophic success," and the death toll for American soldiers would reach 1,000. NOW YOU "C" ME I've also called this the "going get tough" moment, when people get fed up with being fed up, tired of feeling helpless and impotent and, sooner or later, decide that Someone must do Something. For better or worse, this Something has often been war. The greatest "going get tough" moment in Western history may have been the Crusades (Robert Prechter of Elliott Wave International referred to the Crusades as the Middle Ages' equivalent of the jogging craze that struck the West in the late 1970s and early 1980s as a much smaller bear market was winding down). But a number of military conflicts — from the American War of Independence to the Civil War to World War II — all were borne of the bear markets and nadir of social mood that preceded them. This describes to some degree what happened in the first advance of the cyclical bull market from 2002 to 2004. And I have explained the B wave, the 2004 bear market, as a corrective of that burst of enthusiasm and sense of purpose, for lack of a better phrase. How then do we characterize the C wave?
|
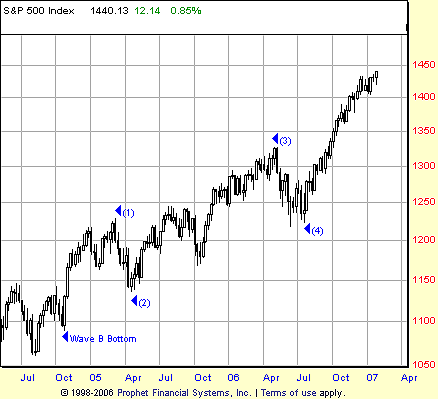
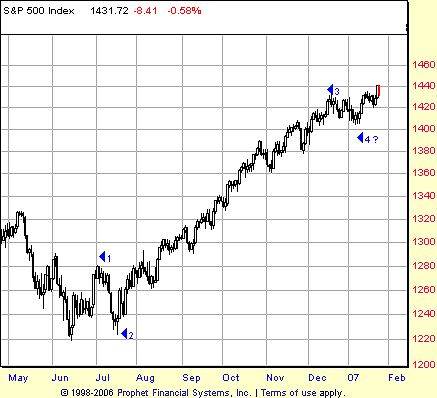
The C wave began in October 2005 and is still in effect. This bull market, which began in part as a repudiation of the most extreme negativity of 2004, now finds itself in a situation in which much of that negativity has gone mainstream. Indeed, as one blogger hosted at the opposition website Daily Kos wrote in response to a Washington Post columnist who referred to the United States as "bitterly divided" over the war in Iraq: With upwards of 70 percent of the American population opposed to just about every aspect of the Iraq debacle, why is (it) that we're still hearing this kind of crap?The idea of discontent going mainstream is helpful in trying to understand how an increasingly unpopular president can preside over both an increasingly unpopular war and a stock market that by some measurements (such as the Dow Jones industrials) is making new, all-time highs. Writing at my social mood blog, I was often stymied at how to predict, for example, the results of the 2006 midterm election. On the one hand, to steal a phrase, we had the varieties of unpopular experience. On the other hand, we had a stock market that reflected if not optimism then a sense of complacency that suggested that whatever ills the world was wrought with were not likely to find our shores any time soon. This notion, of a nation that is sort of in an unpopular war and sort of not, was summed up by one soldier in Iraq who quipped, "We're in Iraq, but the rest of America is at the mall." Technically speaking, wave C has been a fairly clear, five-wave structure extending up from the October 2004 lows to create a wave 1 peak in March 2005, then a wave 2 trough in April followed by a strong, third wave advance into spring 2006 (interrupted by a sharp October 2005 correction during which the American death toll topped 2,000). From there, the market moved lower into a wave 4 low in the summer of 2006. I want to make a point here, particularly insofar as I was able to use Elliott wave/social mood theory to game the Presidential elections in the US in both 2000 and 2004. Elections, as the saying goes, have consequences. But those consequences — or our perception of the strength of those consequences — depend a lot on social mood. As such, historic takeovers of Congress by the political opposition in 1994 and 2002 were heralded as revolutionary and wide-ranging in large part because both events took place during bear market downturns. In autumn 2006, the opposition Democrats won what was by all accounts a historic Congressional victory (in addition to taking over both houses of Congress, not a single Democratic incumbent lost). However, because the event took place in the context of a bull market, the Democrats weren't given the same sort of credit that the Republican revolutionaries of 1994 and 2002 were granted. Nancy Pelosi, the incoming Democratic speaker of the House of Representatives, was widely ridiculed and belittled, and many commentators suggested that she was immediately "on probation." Many supporters of the political left have decried this as evidence of right-wing bias or the power of the modern Republican "noise machine." But there is a different, perhaps more accurate answer: bull markets favor incumbents, and opposition victories in that context have been and will always be treated as minor, inconsequential, or trivial. FROM FOUR TO FIVE The projection method I use is the same one I have used for years and can be found in the book Fibonacci Applications And Strategies For Traders written by Robert Fischer. Fischer's approach to Elliott wave theory is to suggest that there are certain aspects of the theory that can be quantified and anticipated, such as the likely end point of wave 5 of a five-wave sequence. Fischer's method calls for multiplying the amplitude of wave 1 by 1.618 and adding the product to the value at the top of wave 1 in order to get a minimum projection of the wave 5 top. Second, Fischer has traders multiply the amplitude of wave 3 by 0.618 and then add the product to the value at the top of wave 3 to arrive at a maximum projection of the wave 5 top. This method creates a range in which traders can expect wave 5 to peak. Applying Fischer's method to the first set of five waves, the five waves that make up wave C, gets the following range: Minimum projection: Maximum projection: Thus, according to these projections, wave 5 is likely to top between 1,427 and 1,464. Again, these projections should be consistent with those derived from other relevant sets of waves, such as those advancing from the wave 4 bottom in the middle of 2006. After all, both the five waves from the October 2004 bottom and the five waves from the wave 4 bottom in 2006 are moving toward the same destination: a wave C top that is also a wave 5 top. I should add that it is important when following Fischer's method to get the wave 3 top accurately. In my wave count, I called the wave 3 top too soon and thus ended up with an upside projection that turned out to be too low. Looking at the five waves extending from the wave 4, summer of 2006 bottom. I've posited a wave 1 that begins in mid-June at roughly 1225 and ends at 1280 (there is intraweek overlap between wave 1 and wave 4. I am deliberately using the most round numbers for these projections). Wave 3 extends from 1225 to approximately the 1430 area. So the projections look like this: Minimum projection: Maximum projection:
|
| A projection from wave 4 provides a range that, while encompassing the range derived earlier, is almost too generous with a span of more than 180 points. In such instances, taking an average of the two extreme points can be helpful. 1,368.99 + 1,556.69 = 2,925.68 Averaging the minimum and maximum projections provides for a wave 5 and wave C top at or near 1,462.84. What is especially interesting about this figure is that it is well within the range of the earlier projection (1,427.25 to 1,464.05) and only 17-odd points from an average of the two extremes of the earlier projection (that average is 1,445.50). PROJECTION CONNECTION Looking at the shape of the current advance compared to the advance from the spring of 2005 to the spring of 2006, we see more recently a very ordered ascent almost as devoid of major corrections, as the spring 2005 to spring 2006 market was riddled with them (particularly the sharp correction in autumn 2005). I would suggest that markets that move higher without a major correction is another example of the sort of complacency that exists in the market at the present time. From a social mood perspective, it could be argued that the coincidence of an almost comically disliked President presiding over a stock market that is making new highs is a further example of the sort of "What, me worry?" attitude that, whatever the concern or pressing issue of the day, those concerns are, as the saying goes, "no skin off my back." We'll see how long this sentiment lasts. We know from recent experience in the time between the Long Term Capital Management crisis in autumn 1998 and the bursting of the Internet stock bubble in the spring of 2000 that "eras of good feelings" can last longer than most expect. For now, traders are better off looking for dips to buy than they are looking for tops to sell. But a keen eye on longer-term negative divergences in indicators like the moving average convergence/divergence (MACD) histogram — as well as on price action as the S&P 500 approaches the potential top target of 1,462 — would probably be a smart hobby while pursuing the main work of trading and speculating on a market that, until proven otherwise, continues to move higher. |
Technical Writer for Technical Analysis of STOCKS & COMMODITIES magazine, Working-Money.com, and Traders.com Advantage.
| Title: | Traders.com Technical Writer |
| Company: | Technical Analysis, Inc. |
| Address: | 4757 California Avenue SW |
| Seattle, WA 98116 | |
| Phone # for sales: | 206 938 0570 |
| Fax: | 206 938 1307 |
| Website: | www.traders.com |
| E-mail address: | DPenn@traders.com |
Traders' Resource Links | |
| Charting the Stock Market: The Wyckoff Method -- Books | |
| Working-Money.com -- Online Trading Services | |
| Traders.com Advantage -- Online Trading Services | |
| Technical Analysis of Stocks & Commodities -- Publications and Newsletters | |
| Working Money, at Working-Money.com -- Publications and Newsletters | |
| Traders.com Advantage -- Publications and Newsletters | |
| Professional Traders Starter Kit -- Software | |
PRINT THIS ARTICLE

Request Information From Our Sponsors
- StockCharts.com, Inc.
- Candle Patterns
- Candlestick Charting Explained
- Intermarket Technical Analysis
- John Murphy on Chart Analysis
- John Murphy's Chart Pattern Recognition
- John Murphy's Market Message
- MurphyExplainsMarketAnalysis-Intermarket Analysis
- MurphyExplainsMarketAnalysis-Visual Analysis
- StockCharts.com
- Technical Analysis of the Financial Markets
- The Visual Investor
- VectorVest, Inc.
- Executive Premier Workshop
- One-Day Options Course
- OptionsPro
- Retirement Income Workshop
- Sure-Fire Trading Systems (VectorVest, Inc.)
- Trading as a Business Workshop
- VectorVest 7 EOD
- VectorVest 7 RealTime/IntraDay
- VectorVest AutoTester
- VectorVest Educational Services
- VectorVest OnLine
- VectorVest Options Analyzer
- VectorVest ProGraphics v6.0
- VectorVest ProTrader 7
- VectorVest RealTime Derby Tool
- VectorVest Simulator
- VectorVest Variator
- VectorVest Watchdog


