HOT TOPICS LIST
- Strategies
- Stocks
- Buy
- Investing
- Brokers
- Psychology
- Interviews
- Accumulate
- Sell
- Hold
- Spotlight
- Websites
- Candlestick Corner
- Gold & Metals
- Options Trading
LIST OF TOPICS
FOCUS ON
Charting Cramer: NYX, AAPL, And CSCO
04/11/07 05:46:41 PM PSTby David Penn
The previous installment of "Charting Cramer" drew attention to the King of Cramerica's value picks for 2007. This time, we turn our attention toward stocks that represent opportunities for growth.
| "Growth," says Jim Cramer, host of CNBC's Mad Money and founder of TheStreet.com, "is like crack to Wall Street." Growth in earnings, growth in revenue, growth in going from regional to national or from national to global — it seems as if there are few iterations of "growth" that Wall Street isn't obsessed with. It's an obsession that is easy to appreciate. When it comes to growth stocks, most investors tend to look to the smaller-cap stocks, to the NASDAQ for example, for diamonds in the rough. As long as larger companies and corporations still have new products to develop and sell, and ever-expanding markets in which to sell them, however, investors would be mistaken to limit their quest for growth stocks to merely those that are small in market capitalization. Often, some of the best potential for growth comes from big-but-still-growing companies and/or corporations with a proven track record of success. Of the three companies that Cramer believes will see their stocks do well in 2007 — three companies that he insists qualify as growth-oriented for reasons already stated — one is a relative newcomer to being publicly traded (ironic insofar as the company is the New York Stock Exchange, home of some of the largest and most successful corporations in the world). The other two companies are both technological in nature: one (originally Apple Computers, now Apple Inc.) so wedded to innovation in consumer electronics as to be one of the engines of popular culture in the United States, if not the Western world in general), and the other, Cisco, an overgrown comeback kid from the heady investing days of the dotcom 1990s. EXCHANGE THIS! The story of the NYSE as a public company is another example of how already large companies can continue to grow. While some investors look askance at mergers & acquisitions as a growth strategy — a strategy that big corporations like Cisco have also pursued — most acknowledge that quality mergers & acquisitions, ones in which there is a great deal of synergy between the partners, can be every bit as effective and efficient for the economy as growth that truly breaks new ground and creates new markets.
|
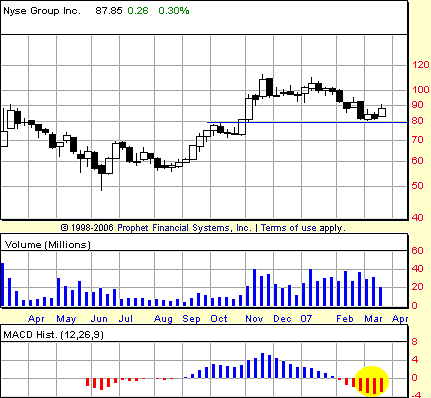
| Looking at the chart of NYSE (Figure 1), we see a market that declined shortly after becoming public, dropping to as low as $50 a share when it bottomed in June 2006. Since that bottom, however, NYX has been impressive. After initially failing at moving average resistance in late June and early July, NYX put in a higher low in late summer before breaking out above moving average resistance in September. October 2006 saw the NYX moving largely sideways in preparation for another push higher, one that began in earnest as October transitioned to November. The current all-time high in NYX was made shortly afterward in late November 2006 between $105 and $110. Since the November high, NYX has been in correction mode — the longest correction since the move down shortly after shares were made publicly available. While this correction has likely taken much of the enthusiasm out of those who profited from NYX's journey from the high 50s to the high 90s, a close look at the correction shows a market that appears to have found significant support. The sources of this support are twofold: in the first instance, the 20- and 50-period exponential moving averages that provided resistance back in summer 2006 now appear to be providing support in spring 2007. A second source of support appears to come from the October 2006 consolidation range between the mid-70s and the low 80s. On weekly charts, I find the MACD histogram (the moving average convergence/divergence histogram) to be an excellent trend-following indicator. In particular, I like to look for an instance in which the MACD histogram has been going down, enters negative territory, and then begins to tick upward. If there is price follow-through to the upside beyond the high of the session that marks the tick higher (ideally, a bullish P-p-P pattern in the histogram; see my Working Money article "Trading The MACD Histogram" for more on P-p-P patterns), then an opportunity to the long side is often present. As just one example, note the P-p-P pattern in the MACD histogram in June 2006 when NYX bottomed and began moving higher. Although the market did pull back, the price low that accompanied the low "p" part of the pattern was never challenged during the correction. In fact, the first three weeks of August saw another P-p-P pattern that helped mark the end of the summer correction in NYX. It remains to be seen whether NYX will complete the bullish P-p-P pattern that it has been building since early March. Not only does NYX need to complete the pattern, but also there needs to be follow-through to the upside. If the pattern is completed in the first three weeks of March but in the fourth week NYX moves downward — in effect creating a P-p-P-p pattern — then the prospects for upside will grow somewhat dimmer. What is key for those looking to buy NYX is a combination of three things: continued support at the moving averages, a successful P-p-P pattern, and follow-through to the upside in the final week of March 2007. THE "IT" COMPANY Although Apple Inc. has been around for decades, I can't think of another company — not Amazon, not Starbucks, not even Google — that has done a better job of both recreating itself as well as representing the cutting edge of American popular culture in the late 20th and early 21st centuries. From its widely popular notebook computers to its even more widely popular iPod music and video players, Apple has consistently managed to tap into consumer electronic culture, giving consumers what they wanted seemingly right before they realized just what it was they couldn't live without.
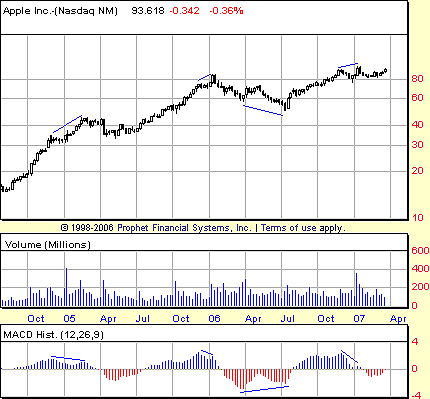
Unlike the New York Stock Exchange, there is plenty to look at historically in Apple's weekly price chart, though much of what should get and keep our attention is similarly visible over the past year or so worth of data (Figure 2). The most recent correction in AAPL occurred in the first half of 2006 as the stock fell from a high north of 86 in January to a low of about 50 by July. This downturn was anticipated by negative divergences in both the MACD histogram and the stochastic, though on weekly charts it is the MACD histogram that often reveals the most accurate divergences. It's worth noting that previous to this correction, AAPL ramped from a prior correction low of about 35 in the late spring of 2005 — a prior correction that was also anticipated by a negative divergence in the MACD histogram.
|
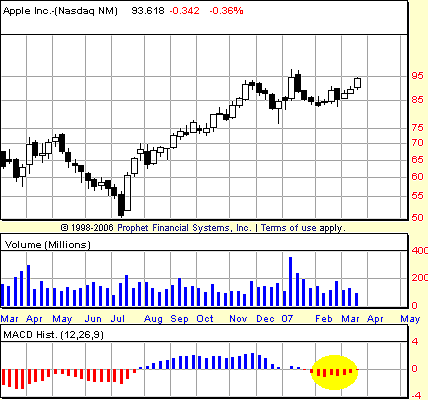
| Since summer 2006, AAPL embarked upon a six-month bull market, rallying to an intraweek high of $97.80 in January 2007 (Figure 3). Here again another pair of negative divergences in the MACD histogram and the stochastic signaled a correction. AAPL shares shortly after began moving lower, dipping below $84 by early February. What is interesting about AAPL right now is that the stock has been riding its 20-week exponential moving average higher since early February 2007, a move higher that is confirmed by the P-p-P pattern in the MACD histogram over the course of the first three weeks of February (see my two-part Working Money article, "Trading The MACD Histogram," for more on the P-p-P pattern). When by the third week of March, the market moved above the high of the third week of February (which coincides with the last "P" in the P-p-P pattern), a signal was given that AAPL was ready to move higher, likely toward a showdown with its year-to-date highs — highs that also represent all-time highs for Apple Inc. THE CISCO KID WAS A FRIEND OF MINE Of course, that was then. After peaking in the spring of 2000, the thrill ride turned into a nightmare as shares of Cisco plummeted along with the rest of the volatile technology sector. The stock fell for more than two and a half years, virtually without respite, until finally bottoming — along with the rest of the stock market — in the autumn of 2002. It is a market truism that the stock market leaders of yesterday will not be the market leaders of tomorrow. And in this Cisco was little different. More than four years after that October 2002 bottom, Cisco has barely retraced 25% of its 2000–02 bear market. By way of comparison, Microsoft recently climbed to a Fibonacci 38.2% retracement of its 2000–02 bear market, and Amazon.com, another belle of the dotcom ball, managed a 50% retracement within two years of its 2002 bottom.
|
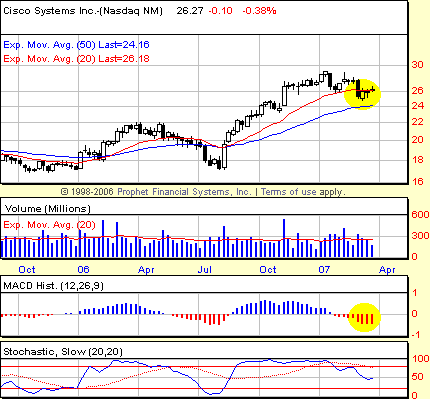
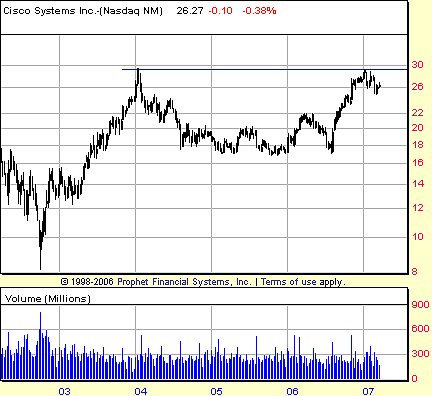
| So why turn to Cisco for opportunities for growth now? Is it just Cisco's "turn"? According to Jim Cramer, Cisco benefits in 2007 by being different from the Cisco of 1997. Today, it is the nexus of telephone, Internet, and video that benefits Cisco in the same way that a number of telecommunications and other telecom equipment providers have benefited (take a look at a long-term chart of TTH, the telecom HOLDRS). Not entirely unlike AAPL, Cisco, according to Cramer, has found a new role as a "consumer-oriented tech stock" with the added advantage of being the 800-pound gorilla in its field (one of Cramer's oft-repeated maxims is to avoid buying the stock of companies that compete with Cisco). In Cisco, we see a stock that bottomed in the autumn of 2005 around 17, rallied to 22 during the spring of 2006, and then corrected to test the 2005 lows during the summer of 2006 (Figure 4). From summer 2006 to the first few weeks of 2007, CSCO rallied from just north of 17 to just shy of 29, where it ran into resistance likely left over from the January 2004 highs. Since failing at resistance, CSCO has pulled back to — and briefly slipped below — its 20-week exponential moving average (EMA). This pullback was telegraphed by the MACD histogram, which gave its first of two negative divergence sell signals approximately seven weeks before the top (the second came as of the close of the week following the top).
|
| That Cisco is moving closer and closer to its 50-week exponential moving average during the current correction provides some hope for CSCO bulls that the stock might find support at or about the 24 level. It is worth noting that Cisco just failed in its attempt to take out a high that has lasted for more than three years, so it would not be surprising if, rather than falling a great deal further, the stock instead moved sideways for a period of time, testing the 29–30 level before making another effort to break through and move still higher. At present, in the weekly chart we can see a sort of cup or bowl without handle pattern that CSCO has formed since the January 2004 top (Figure 5). That bowl measures approximately 12 points, suggesting that a strong move higher in the stock could catapult Cisco to the low 40s before any additional correction manages to bring it back. David Penn may be reached at DPenn@Traders.com. SUGGESTED READING |
Technical Writer for Technical Analysis of STOCKS & COMMODITIES magazine, Working-Money.com, and Traders.com Advantage.
| Title: | Traders.com Technical Writer |
| Company: | Technical Analysis, Inc. |
| Address: | 4757 California Avenue SW |
| Seattle, WA 98116 | |
| Phone # for sales: | 206 938 0570 |
| Fax: | 206 938 1307 |
| Website: | www.traders.com |
| E-mail address: | DPenn@traders.com |
Traders' Resource Links | |
| Charting the Stock Market: The Wyckoff Method -- Books | |
| Working-Money.com -- Online Trading Services | |
| Traders.com Advantage -- Online Trading Services | |
| Technical Analysis of Stocks & Commodities -- Publications and Newsletters | |
| Working Money, at Working-Money.com -- Publications and Newsletters | |
| Traders.com Advantage -- Publications and Newsletters | |
| Professional Traders Starter Kit -- Software | |
PRINT THIS ARTICLE

Request Information From Our Sponsors
- StockCharts.com, Inc.
- Candle Patterns
- Candlestick Charting Explained
- Intermarket Technical Analysis
- John Murphy on Chart Analysis
- John Murphy's Chart Pattern Recognition
- John Murphy's Market Message
- MurphyExplainsMarketAnalysis-Intermarket Analysis
- MurphyExplainsMarketAnalysis-Visual Analysis
- StockCharts.com
- Technical Analysis of the Financial Markets
- The Visual Investor
- VectorVest, Inc.
- Executive Premier Workshop
- One-Day Options Course
- OptionsPro
- Retirement Income Workshop
- Sure-Fire Trading Systems (VectorVest, Inc.)
- Trading as a Business Workshop
- VectorVest 7 EOD
- VectorVest 7 RealTime/IntraDay
- VectorVest AutoTester
- VectorVest Educational Services
- VectorVest OnLine
- VectorVest Options Analyzer
- VectorVest ProGraphics v6.0
- VectorVest ProTrader 7
- VectorVest RealTime Derby Tool
- VectorVest Simulator
- VectorVest Variator
- VectorVest Watchdog

