HOT TOPICS LIST
- Strategies
- Stocks
- Buy
- Investing
- Brokers
- Psychology
- Interviews
- Accumulate
- Sell
- Hold
- Spotlight
- Websites
- Candlestick Corner
- Gold & Metals
- Options Trading
LIST OF TOPICS
MARKET UPDATE
The Dollar And Deflation
04/27/07 03:21:05 PM PSTby David Penn
As the dollar moves toward a test of long-term lows, fears of inflation have completely eclipsed the possibility of a reversal in the greenback.
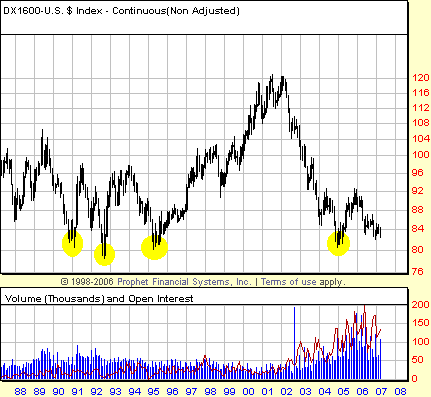
| Maybe it was hearing still yet another commentator point to a chart of gold and begin ridiculing the possibility of the global economy slipping into a deflation that got me hauling out my long-term charts of the dollar, gold, and key international currencies such as the euro and the yen. One thing you can say about the inflationist argument — other than it has the Church of What's Happening Now on its side — if the dollar is about to be "sacrificed" for the sake of the economy, then we will not have to wait much longer to see the blood from that fatted calf. Currently trading in the low 80s (basis the US Dollar Index), the greenback is once again moving ominously close to some major historic lows. The nearest of such lows is the late 2004 low near 80.48. This low came at the end of a vicious bear market in the dollar that began early in 2002 with the greenback (basis continuous futures) at approximately 120. Before the 2004 low, this level had been repeatedly tested as the dollar was bottoming in the early 1990s — specifically in early 1991, mid-1992 when the greenback technically found a bottom at 78.43, and in the spring of 1995, when the 1992 lows were tested. So if the dollar is going to hell in a handbasket, it could be argued that it is as closer to departure time as it has ever been.
|
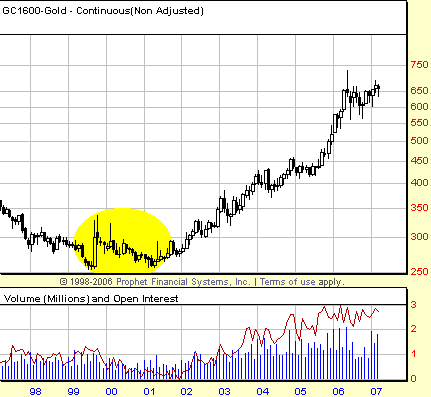
| But one thing continues to stymie my appreciation of the inflationist argument, an argument that says that gold will continue rising into the quadruple digits, that the dollar will be ruined, and that hyperinflation will swallow the economy ... and that is a chart of the gold price since 2000. Gold has already rallied more than 287% in the seven years from historic lows in the summer of 1999 to near-historic highs in the summer of 2006. In fact, gold has almost completely retraced its secular bear market decline from the all-time high in January 1980 spike north of 850. It may be possible for the gold market to be on the verge of a move still higher, up into the hyperinflationary stratosphere. But it would be a mistake to not realize that a certain significant amount of appreciation has already taken place in gold, and that it may be a market more primed for correction than for further, even more vertical gains. WHAT IS DEFLATION? What is deflation? If inflation refers to the situation of "too much money" chasing "too few goods" and services, then deflation, at its most simple, can be considered an example of the opposite: "too little money" chasing "too many" goods and services. How can there be "too little money"? By now, most have heard of Federal Reserve Board chairman Ben "Helicopter" Bernanke's widely shared notion that should the US economy ever find itself with "too little money," the availability of a technology called a "printing press" would help stave off a deflationary crisis. As such, the idea of having "too much money" driving prices higher is relatively easy for most to understand — even if you didn't live through the inflationary 1970s.
|
| However, an economy can also have "too little money" vis-a-vis the demand for money, making the currency in which the demand is denominated in relatively more valuable than the assets that can be purchased by that currency. An easy way to explain this would be to consider a person who has too many credit cards or other debt obligations. A "debt" is a promise to pay at some future date. It represents a "demand for money." The more a person — or a municipality or a nation-state — carries in debt, the greater his burden to provide the currency the debt is denominated in at some point in the future. That presents little problem much of the time, as the proceeds from borrowed money (or what is called self-liquidating credit) are sufficient to repay the loan, plus interest, along with providing whatever profit or return the borrower anticipated. But when the proceeds of the borrowed money are lacking, or when there is an overabundance of borrowing that is not geared toward productive purposes (also called non self-liquidating credit), an inability to repay in cash leads to cash being more highly valued relative to other assets. I think this notion of deflation or, more specifically, debt-deflation is important because without it, it becomes hard to imagine the government not being able to simply "printing press" its way out of a truly towering mountain of debt at particularly the government and individual levels. As Rick Ackerman, publisher of Rick's Picks and one of the most articulate commentators on the topic of deflation, has put the problem of the "printing press" solution: Inflate-or-die long ago reached the point of diminishing returns ... In the early 1990s, I did a piece for Barron's that focused on the relationship between debt and GDP growth. At the time, we were getting about 38 cents' worth of growth for each dollar borrowed at the margin. I thought this spelled disaster, unable to imagine at the time that ten years hence, we would be borrowing as much as $6 in a fiscal quarter to 'create' a single dollar's worth of growth. Ackerman concludes: "The fact that we have increased borrowing in the last several years by trillions of dollars to produce so faint a 'recovery' should be telling you something." THE FACES OF DEFLATION However, the past four years have been characterized by rising gold prices, rising long-term interest rates and rising stock prices. As such, it is hard to characterize the past four years as anything but an inflationary (or at least money expansionist) episode. This movement, in which stock prices and bond yields are moving in the same direction, is the exact opposite of what we saw in Japan during its deflationary episode in the 1990s. As such, I want to focus on what deflation looks like in the charts. Most of us have a sense of what is supposed to happen in a deflation from the brief deflationary panic of 2002: asset values fall, the burden of debt in real terms becomes greater — even if interest rates remain low in real terms, and the currency in which most of the debt is denominated becomes more valuable. So, translating these "faces of deflation" into charts, we should expect bear markets in stocks and gold (after all, you can't pay a mortgage with a stock certificate or a bar of gold) and bull markets in both the dollar and in US Treasury notes. Look at the charts of those four asset classes in the spring of 2007, and it would be little surprise why there is so little support for the deflationist cause. Both gold and the stock market (the latter as measured by the Standard & Poor's 500) have been in bull markets for years and were as early as spring and autumn 2006, respectively, flirting with all-time highs. By contrast, the US dollar is perennially on the ropes, dipping toward all-time lows in late 2004 and again in the autumn of 2006. The market for US Treasuries has been similarly bearish for the past few years. It is complacency in the face of these trends that interests me most, the sense that both gold and the stock market — which have already enjoyed enduring bull markets — will only continue to do so. And while the pessimism in the bond markets is less pronounced than that of the market for dollars (where pessimism is all-pervasive), the fact that Treasury notes have finished down for four years in a row is not lost on anyone.
|
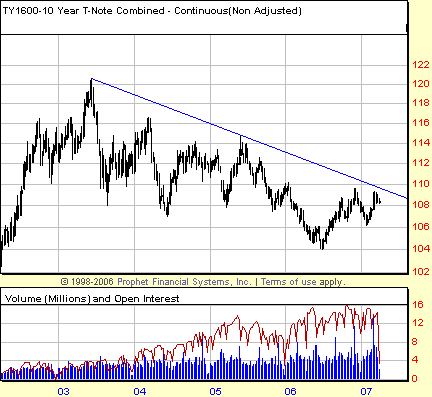
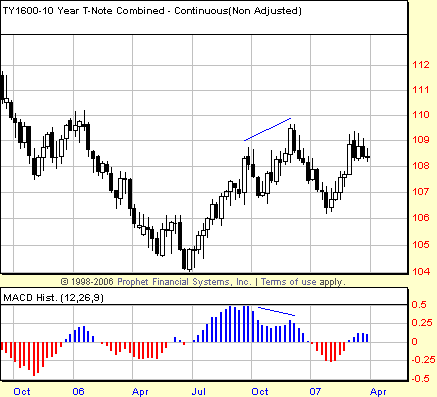
| The long and short of this is that if we can find technical reasons for these trends to reverse, for tops in gold and the stock market and bottoms in the bond and US dollar markets, then the case for deflation will have the sort of technical foundation that will be hard for the inflationists to deny. Of course, it will not be until the bond markets are soaring, pushing long-term interest rates into the ground as investors clamor for the safety of dependable, cash-generating assets, even at historically low rates, and the dollar is similarly arcing higher, before people see the threat of deflation in the way they currently see the threat of inflation. But if we are able to see the shift as it happens, to see the technical foundation for the inflationary case give way, then we will be in a much better position both to protect ourselves from deflation's discontents, as well as to profit from the new opportunities created, especially in the early stages of the shift. BOUNCING BONDS? The most interesting technical development in the long-term bond market charts — charts that reveal a clear downward trend in the bond market since a peak in the spring of 2003 — is the negative divergence in the weekly MACD histogram that developed in the second half of 2006. This divergence — which was mirrored by a positive divergence in the long-term chart of the $TNX, or 10-year Treasury yield index — is important for one particular reason. Focusing on the bond side of the mirror (rather than the yield side), we can see that the Treasury note market bottomed in the spring of 2006. This bottom was anticipated by a series of higher lows in the moving average convergence/divergence (MACD) histogram going back to the first such positive divergence in the spring of 2004. The bounce from the 2006 bottom has yet to take out a previous high (the high from January 2006 would be the first such milestone). But in the course of the post-negative divergence correction, the T-note market has established a higher low in the first few months of 2007. The question is whether the correction anticipated by the negative divergence — a negative divergence between the September and December 2006 peaks — has been resolved by the December 2006 to February 2007 decline. If it has, then we should expect the Treasury note market to continue moving higher and eventually take out the January 2006. This would be a critical step in building the case for a move higher in bond prices, an argument that would have to be won before the deflationary case could even get a proper hearing.
|
| It is worth noting that the negative divergence in the bond chart is miniscule compared with the positive divergences that have been building since the spring of 2004. So the long-term bet remains that a bottom in the bear market in bonds that began in mid-2003 is still in the making. That doesn't prevent further correction and a retest, for example of the 2006 lows. In fact, even if the 2006 lows were exceeded to the downside, the case for a bottom in bonds would remain valid as long as the series of positive divergences remains intact. Given my suspicion that both the stock and gold markets have another surge higher before they make more enduring tops, it would not surprise me in the least if the bond market did indeed make that test of the 2006 lows. This assumes that the markets move in sync, which is not always the case. Even markets that are tracking one another often lag by days, weeks, or even months — sending off confusing signals to traders, speculators, and investors alike. Consider, for example, the relationship between stocks and bonds over the past four years. The 10-year note topped in mid-June 2003. Stocks, however, had bottomed months earlier in October 2002 and managed to test that bottom in March 2003, and while bonds were moving largely sideways between October 2002 and March 2003, bonds rallied into their top precisely as the bull market in stocks was getting under way. So it could be reasonably argued that there was as much as a seven-month lag between the stock and bond market's interpretation of the economy going forward. This is understandable, insofar as markets are no better than the human beings who trade them. But it is worth remembering as both the bond and dollar markets forage for bottoms in 2007, even as the stock and gold markets look poised to continue moving higher. SUGGESTED READING |
Technical Writer for Technical Analysis of STOCKS & COMMODITIES magazine, Working-Money.com, and Traders.com Advantage.
| Title: | Traders.com Technical Writer |
| Company: | Technical Analysis, Inc. |
| Address: | 4757 California Avenue SW |
| Seattle, WA 98116 | |
| Phone # for sales: | 206 938 0570 |
| Fax: | 206 938 1307 |
| Website: | www.traders.com |
| E-mail address: | DPenn@traders.com |
Traders' Resource Links | |
| Charting the Stock Market: The Wyckoff Method -- Books | |
| Working-Money.com -- Online Trading Services | |
| Traders.com Advantage -- Online Trading Services | |
| Technical Analysis of Stocks & Commodities -- Publications and Newsletters | |
| Working Money, at Working-Money.com -- Publications and Newsletters | |
| Traders.com Advantage -- Publications and Newsletters | |
| Professional Traders Starter Kit -- Software | |
PRINT THIS ARTICLE

Request Information From Our Sponsors
- StockCharts.com, Inc.
- Candle Patterns
- Candlestick Charting Explained
- Intermarket Technical Analysis
- John Murphy on Chart Analysis
- John Murphy's Chart Pattern Recognition
- John Murphy's Market Message
- MurphyExplainsMarketAnalysis-Intermarket Analysis
- MurphyExplainsMarketAnalysis-Visual Analysis
- StockCharts.com
- Technical Analysis of the Financial Markets
- The Visual Investor
- VectorVest, Inc.
- Executive Premier Workshop
- One-Day Options Course
- OptionsPro
- Retirement Income Workshop
- Sure-Fire Trading Systems (VectorVest, Inc.)
- Trading as a Business Workshop
- VectorVest 7 EOD
- VectorVest 7 RealTime/IntraDay
- VectorVest AutoTester
- VectorVest Educational Services
- VectorVest OnLine
- VectorVest Options Analyzer
- VectorVest ProGraphics v6.0
- VectorVest ProTrader 7
- VectorVest RealTime Derby Tool
- VectorVest Simulator
- VectorVest Variator
- VectorVest Watchdog


