HOT TOPICS LIST
- Strategies
- Stocks
- Buy
- Investing
- Brokers
- Psychology
- Interviews
- Accumulate
- Sell
- Hold
- Spotlight
- Websites
- Candlestick Corner
- Gold & Metals
- Options Trading
LIST OF TOPICS
THE OPTIMIZED TRADER
Measures And Half Measures
05/04/07 11:57:15 AM PSTby David Penn
What happens when a market's measured move makes it halfway?
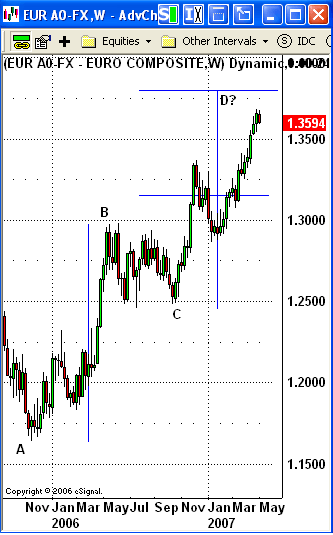
| Back in early March I pointed out a measured move pattern in the currency pair USD/CHF ("Measured Moves In The Swiss Franc," March 3, 2007, Traders.com Advantage). I also included some of the observations Thomas Bulkowski made of such patterns in the second edition of his book, Encyclopedia Of Chart Patterns. What I did not underscore in those observations was that Bulkowski was much more impressed by the performance of measured move down patterns than he was by measured move uppatterns. Of the latter (and the Swiss franc mentioned was an example of a measured moved up), Bulkowski noted: "The measured move up (MMU) is the reverse of the measured move down but with worse performance. In a perfect world, the first and last legs would be the same length ... Using the first leg height, in dollar, projected upward from the bottom of the corrective phase to get a target price only works 45% to 56% of the time ..." By Bulkowski's standards, this is significantly subpar. His solution? "What all this information means is that when predicting a price target, be conservative. The best approach is to use half the first leg move projected upwards." This struck a nerve. The measured move pattern is essentially an ABCD pattern, with AB represented the first leg, BC representing a correction, and CD representing the second, post-correction leg. A number of traders have looked at different ways of exploiting the ABCD pattern, particularly in trying to pinpoint where point D will be. Finding point D not only provides an upside target once point C, the end of the correction, is determined. Knowing where point D is likely to be also sets up the opportunity to reverse direction, shorting a market that is rallying into point D in an uptrend or buying a market that is falling toward point D in a downtrend. One of the traders to do the best job of exploiting the measured move/ABCD pattern is Rick Ackerman of Rick's Picks (http://www.rickackerman.com). Ackerman's approach, as he described it in an interview with Technical Analysis of STOCKS & COMMODITIES in February 2005, is derived in part from the work of Charles Lindsay, whose ABCD method was explained in his book, Trident: A Trading Strategy, back in the 1970s. There's a great deal more to Ackerman's "Hidden Pivot" trading and analysis method than measured moves. And, in fact, Ackerman even points out what he considers obvious flaws in Lindsay's ABCD approach. But there are enough interesting similarities between analyzing measured moves and the success of pattern-oriented traders like Ackerman that traders might want to consider applying measured move/ABCD analysis to their set of technical templates. To recap, Bulkowski fears that the AB leg of a measured move, particularly a measured move up, will not often enough be as long as the CD leg, as a more traditional, swing rule–style analysis might suggest. He suggests making a target of 1/2 AB, adding (or subtracting, in the case of a downtrend) half the length of the AB leg to the value at the end of the BC correction. That said, Bulkowski adds: "As the stock approaches the target price, do not be too quick to sell. If prices are on a roll, go with the flow and wait for prices to start declining. Obviously, if prices pause near but below the target price, then it might be wise to sell." Ackerman's take on the ABCD pattern — in part — also has traders looking to that 1/2 AB added to (or subtracted from) the end of the BC correction phase. In fact, my reading of Ackerman shows this 50% point to be a key level in helping determine whether the balance of the CD leg will actually end up equaling — or even surpassing — the length of the AB leg. He has called this "midway point of the large pattern's C-D leg ... one of several types of inflection points that I refer to ..." Later, referring to a specific opportunity in gold in a 2003 article, Ackerman explained that, "each C-D sub-leg has a %91midpoint pivot' that represents a formidable rally obstacle" before adding "the rally has easily penetrated %91midpoint' pivots ... a strong indication it will continue at least to the %91D' targets associated with those pivots." It is worth iterating here that there is more to Rick Ackerman's trading methodology than what is shown here in this discussion of measured moves (for more information about Ackerman's method, visit his website). But note the compatibility of between the above and what we know about trading measured move patterns. Consider the chart of the weekly euro in Figure 1. The euro bottomed in late 2005 near 1.16, rallied to just shy of 1.30 in spring 2006, and then moved in a largely sideways consolidation until the autumn (a low of about 1.25) before again resuming its advance. As the low in autumn 2006 was made, there were two questions to be answered: (1) Will the euro take out the 2006 high just south of 1.30, and (2) if so, how far beyond that high is a reasonable upside target? Applying the ABCD pattern to this measured move, we get more specific values of the 2005 low or A at 1.1639, the spring 2006 high or B at 1.2980, and the autumn 2006 low or C at 1.2484. This gives us an AB that is 1.2980 - 1.1639 or 0.1341. Since we are looking at a measured move up, we would add that 0.1341 to the value at C for a measured move upside target of 1.3825. That figure, 1.3825, is our point D.
|
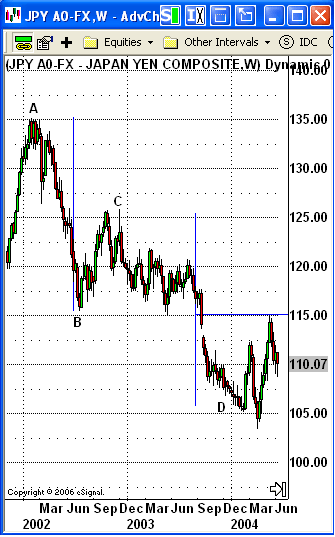
| Yet both Bulkowski and Ackerman would encourage us to consider the 1/2 AB point first — Bulkowski to help create a more conservative upside projection, Ackerman to provide a "make or break" point for the balance of the measured move (that is, the possibility of reaching point D). Halving 0.1341 gives us 0.0671 which, when added to the value at point C, gives us a target of 1.3155. In December, the euro smashed past the 1.3155 level, more than meeting the conservative upside projection Bulkowski called for while simultaneously suggesting that the EUR/USD had more upside based on a more Ackerman-like take on the ABCD pattern. After peaking out at 1.3369, the euro corrected to a low of 1.2866 — just below the 1.2980 breakout level. But the inference from the euro's ability to smash past the 1.3155 level was proven telling inasmuch as the euro resumed its march higher en route to setting new, all-time highs against the US dollar. Traders who had played the measured move up could have easily taken profits once the 1/2 AB point at 1.3155 was breached. After applying a breakeven stop — depending on the entry — most traders would still be long the EUR/USD as it crosses the 1.3400 level in April and well into 1.3600 territory come May. Even those traders who might not have used a breakeven stop and instead completely exited the position at the 1/2 AB point would have been able to resume the long trade based on any one of a number of weekly moving average convergence/divergence (MACD) histogram or 7,10 stochastic buy signals in early February. Next is an example of a measured move down in the weekly USD/JPY (Figure 2). The dollar topped against the yen in February 2002 near 135.16, corrected into the summer of 2002 and bottomed near 115.49, then rallied into the autumn of 2002 before topping out at 125.74. This gives us point A of 135.16, point B of 115.49, and point C of 125.74. AB is 135.16 — 115.49 or 19.67, and 1/2 AB is 9.84. The D point, the full target, is then C - AB, or 106.07. The midpoint that Bulkowski refers to as the conservative target, is C - 1/2 AB or 125.74 - 9.84, or 115.
|
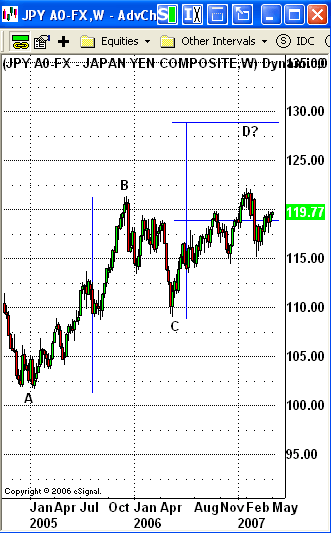
| So far I've focused mostly on exiting measured move trades, at both the conservative, 1/2 AB levels as well as the full target. But how are measured move trades initiated? Bulkowski writes of the measured move down "short the stock as soon as it becomes clear that a measured move is in progress," encouraging traders to exit the position if "prices rise above the corrective phase high." Bulkowski's recommendation for trading measured moves up is similar, suggesting an entry "sometime after the corrective phase completes and prices rise during the second leg." But what signals can a trader use to be assured— or at least to feel as if the odds are in his or her favor — "that a measured move is in progress"? And when is "sometime after the corrective phase completes"? Additional technical tools, both trend-following indicators as well as oscillators, was used to help traders time entries just as the BC corrective leg of the measured move is coming to an end. A simple close over an exponential moving average, a bullish cross between the +DM and -DM, a curling-up of a short-term stochastic, a P-p-P pattern in the MACD histogram — all of these can help traders pinpoint buying entries as the BC leg moves toward completion. Traders can also look toward certain candlestick patterns to indicate when a correction may be exhausted. Shooting stars and bearish engulfing patterns in upward corrections and hammer candlesticks and morning star patterns in downward corrections are all worthwhile signals for traders trading measured moves to be vigilant for. One common entry when trading measured moves is a breakout entry, which has the trader enter a position just as the beginning of the correction is exceeded — in other words, a post-correction new high in the case of an uptrend, or a post-correction new low in the case of a downtrend. In the case of the EUR/USD measured move trade mentioned previously, this would mean going long when the CD leg surpasses the high at point B. With the USD/JPY measured move trade, the breakout (or breakdown) entry would mean going short when the CD leg fell below the low at point B. Let's take a quick look at a measured move that is still unfolding (meaning it has yet to reach point D). This measured move is in the weekly USD/JPY chart and began in January 2005, with point A at 101.70, point B in December 2005 at 121.39, and point C in May 2006 at 108.99 (Figure 3). This measured move projects to 128.68 (AB + C), with a conservative, midpoint target at 118.84. I've added a 20-period exponential moving average (EMA), a 7/10 stochastic and a standard MACD histogram to target specific entries. The BC correction ran from December 2005 until May 2006, with the USD/JPY slipping beneath the 20-period EMA in late April. Using the first weekly close above that moving average as a buy signal and confirmation that the correction had likely run its course provides for an entry around 115.16 (the weekly close of that session). Using the MACD histogram alone — ignoring the moving average for the time being — we can spot a P-p-P pattern a few weeks earlier that allows for an entry near 113.93. And even lower entry could have been achieved by playing the curling-up of the stochastic in a manner similar to that described by Linda Bradford Raschke as the "ANTI" setup in her book, Street Smarts. With this last example, an entry near 112.65 could have been made. And with a profit target at 118.84, there was ample room for the positions to increase in value. The breakout trade, in contrast, so far has fared much worse, getting the trader long near 121.51, only to have the USD/JPY top out a week later and begin moving significantly lower.
|
| As Rick Ackerman pointed out in his interview with STOCKS & COMMODITIES, another approach is to enter the trade at a specific point along the CD leg. For Charles Lindsay, this point was 25% — or halfway to the midpoint (1/2 AB). Ackerman, however, was critical of this method — particularly for trend-following trading — shunning it for being what he called too "intuitively obvious." (In the example of the USD/JPY, the Lindsay entry would have a trader long at about 113.91.) Given the variety of entry methods with measured moves and a consistent way of gaming profitable exits, what should be kept in mind — is how something as simple as the measured move pattern — not unlike reversal trading with 2B tops and bottoms — can be at the foundation of a trading methodology that is both comprehensible and comprehensive. This look at even this pattern-based trading method is a reminder that, as Ackerman has said of his own, pattern-based, analytic method, there are other ways for chartists and market technicians to study market movement, ways that enable traders "to see charts as %91art' with emphasis on visual elements of harmony, symmetry, and, indeed, beauty." This may seem like an odd rallying cry in a technical analysis world that is increasingly digitized, quantified, and mathematized. But for many traders and speculators who are more moved by the chart itself than by the virtually endless derivations of price, volume, and time created by technical indicators, this cry may be one well worth heeding. |
| SUGGESTED READING Ackerman, Rick [2006]. "Is Dow Staging For Moon Shot?", Rick's Picks, September 18. _____ [2005]. "Rick Ackerman: Trading A Lifetime," Interview, Technical Analysis of STOCKS & COMMODITIES, Volume 23: February. _____ [2003]. "Why Pivots Point Higher + Trading Notes," Market Wise Black Blox, August 3. Bulkowski, Thomas [2005]. Encyclopedia Of Chart Patterns, John Wiley & Sons. Weinstein, Stan [1988]. Secrets For Profiting In Bull And Bear Markets, Dow Jones Irwin. |
Technical Writer for Technical Analysis of STOCKS & COMMODITIES magazine, Working-Money.com, and Traders.com Advantage.
| Title: | Traders.com Technical Writer |
| Company: | Technical Analysis, Inc. |
| Address: | 4757 California Avenue SW |
| Seattle, WA 98116 | |
| Phone # for sales: | 206 938 0570 |
| Fax: | 206 938 1307 |
| Website: | www.traders.com |
| E-mail address: | DPenn@traders.com |
Traders' Resource Links | |
| Charting the Stock Market: The Wyckoff Method -- Books | |
| Working-Money.com -- Online Trading Services | |
| Traders.com Advantage -- Online Trading Services | |
| Technical Analysis of Stocks & Commodities -- Publications and Newsletters | |
| Working Money, at Working-Money.com -- Publications and Newsletters | |
| Traders.com Advantage -- Publications and Newsletters | |
| Professional Traders Starter Kit -- Software | |
PRINT THIS ARTICLE

Request Information From Our Sponsors
- StockCharts.com, Inc.
- Candle Patterns
- Candlestick Charting Explained
- Intermarket Technical Analysis
- John Murphy on Chart Analysis
- John Murphy's Chart Pattern Recognition
- John Murphy's Market Message
- MurphyExplainsMarketAnalysis-Intermarket Analysis
- MurphyExplainsMarketAnalysis-Visual Analysis
- StockCharts.com
- Technical Analysis of the Financial Markets
- The Visual Investor
- VectorVest, Inc.
- Executive Premier Workshop
- One-Day Options Course
- OptionsPro
- Retirement Income Workshop
- Sure-Fire Trading Systems (VectorVest, Inc.)
- Trading as a Business Workshop
- VectorVest 7 EOD
- VectorVest 7 RealTime/IntraDay
- VectorVest AutoTester
- VectorVest Educational Services
- VectorVest OnLine
- VectorVest Options Analyzer
- VectorVest ProGraphics v6.0
- VectorVest ProTrader 7
- VectorVest RealTime Derby Tool
- VectorVest Simulator
- VectorVest Variator
- VectorVest Watchdog


