HOT TOPICS LIST
- Strategies
- Stocks
- Buy
- Investing
- Brokers
- Psychology
- Interviews
- Accumulate
- Sell
- Hold
- Spotlight
- Websites
- Candlestick Corner
- Gold & Metals
- Options Trading
LIST OF TOPICS
TRADER'S NOTEBOOK
Builders, Lenders: Next In The Falling Knife Saga
05/16/07 04:12:50 PM PSTby Matt Blackman
Previously, we looked at home builders to see if calls that the industry had bottomed might have some merit. We concluded that the worst was not over. This time, we take another look at the industry but include lenders to see what the charts are saying.
| As the first quarter of 2007 came to a close, news for lenders could not have been worse. After its stock got pummeled following speculation that the second-largest US subprime lender was up against the ropes, New Century Financial filed for bankruptcy and laid off 3,200 workers in the process. In the last year, at least 30 subprime lenders closed or had to seek buyers in an effort to avoid a similar fate, according to Bloomberg News. As a result, lenders, builders, and real estate stocks have been taking it on the chin. But does this mean that the end of the storm is near? Or is this just the eye of a housing hurricane, with the worst yet to come? TIPS OF AN IMMENSE ICEBERG Hundreds of billions of mortgage-backed securities have been bundled in collateralized debt obligations (CDOs) over the last two years in what Grant described as "wild and woolly, wholly reckless" abandon in mortgage underwriting -- so much so that it "measurably heightens recession risk." But only when one cuts to the heart of what he calls the micro issue -- the leviathan CDO derivatives market -- does the scope of the problem become clear. It also shows how the wall separating prime and subprime loans that many believed inviolable has been surreptitiously breached. "Hundreds of billions of dollars of these %91science projects' of collateralized debt obligations and the like are sold in any year -- immense amounts," Grant recounted in a discussion with Bloomberg News in March. "What are they? You take a bunch of loans and then fashion an asset-backed security from those loans. Then take those loans and repackage them into a collateralized debt obligation, a CDO. There can be a million individual loans in a CDO. "Now here is the magic and mystery of a CDO," Grant continued. "You can take 70% of a pile of triple-B minus [meaning marginal credit] and the rating agencies will bless it. "They will say that %91we have studied the correlations and trends and we pronounce 70% of this pile of junk to be triple-A.' Triple-A!" WHAT GOES UP...
|
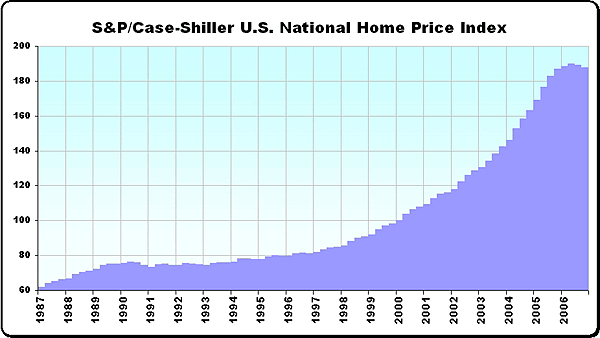
| Needless to say, Grant's outlook is not positive. "I think that the credit cycle will proceed, risk will be repriced and be recognized where it has not been recognized, debt will be more expensive and people will be hurt because they can't refinance [at least 20% of the loans written in the last two years would not qualify today under new lending guidelines] and the housing situation will be visibly worse." Grant estimates that 40% of the mortgages issued last year were either subprime or "Alt-A" (one step above subprime) mortgages and therefore risky. He has a point. Subprime loans jumped from $100 billion in 2000 to $800 billion in 2006, thanks in large part to the willingness of investors to buy mortgage-backed CDOs, especially after they'd been blessed as predominantly triple-A (or prime) by rating agencies. It meant that there was lots of cheap money around and real estate prices soared. But the rocket ride couldn't last. According to a March 2007 report by the Center of Responsible Lending, 91% of subprime loans made nationwide since 1998 were used to refinance existing mortgages affecting 2.4 million Americans. Approximately 50% of those funds were used to finance consumer purchases and have hence driven overall economic growth. The Center estimates that one million of these borrowers could lose their homes -- that's roughly one out of every seven homes sold each year in the US. According to the Mortgage Bankers Association, lenders started foreclosure proceedings against more than one in 200 homeowners in 2006. Florida, the nation's real estate hotspot until recently, now leads the nation in foreclosures, with California running a close second. Doesn't sound like the kind of problem that has a quick and painless resolution, but what does it mean for stocks? CHART-CHALLENGED CHEERLEADERS
|
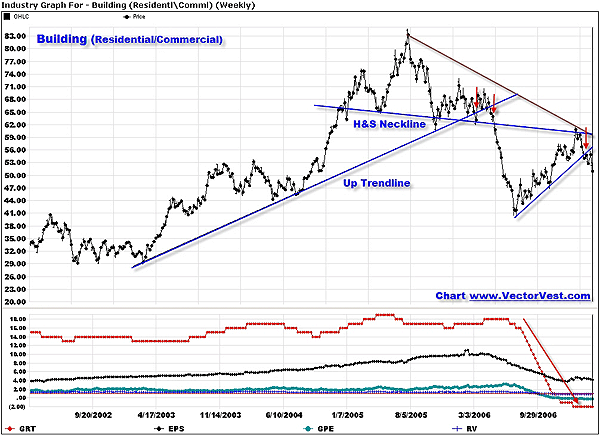
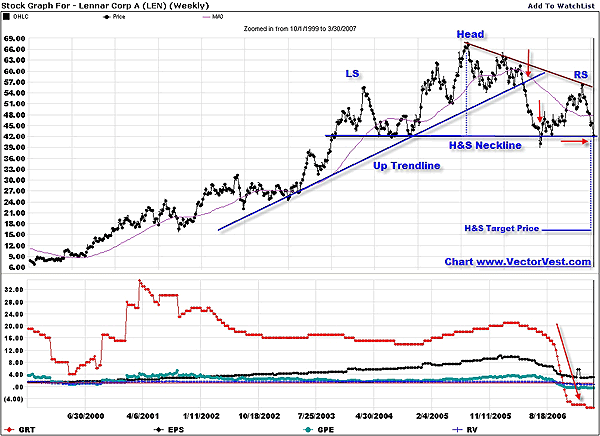
| This latest nine-month surge gave a number of clues to indicate that it was more likely a bear market rally than a sustainable move. First of all, the pattern bore a striking resemblance to a bearish flag pattern/rising wedge. Another indication was that average volume declined while the pattern was forming. This perspective was further supported by deteriorating fundamentals such as earning growth, relative valuation, and earnings per share. There was obviously something wrong in the home construction Camelot as well as with the wishful theory that the bottom was just around the corner. As we see from one of the strongest builders in the Builders Index, Lennar Homes (LEN) in Figure 3, the chart looks anything but bullish. In the beginning of April 2007, the stock broke down through the head & shoulders top neckline (see red arrow, far right) in a pattern that had begun forming in mid-2003. But only after the technicals had broken down did earnings growth turn negative (mid-November 2006).
|
| SUPPORTING CAST The pattern for LEN was a case of industry deja vu. The Builders Index had experienced a similar pattern that was confirmed nearly a year before (see Figure 2). On April 28, 2006, the trend that began in mid-2000 had decisively breached its long-term trendline, followed by the head & shoulder top neckline breach in the third week of May 2006 (second red arrow). Earnings growth rate had declined to zero by the end of November 2006 and has since declined to -2%. Growth to PE (GPE) (teal line) turned negative in mid-December and has dropped farther into negative territory since. After peaking at $10.89, earnings steadily dropped, hitting a low of $3.73 per share in early January before rebounding to $4.68 in early February, but they started dropping again. After peaking in June 2006, relative value (RV) began a slow but steady decline, turning negative in October, and as of mid-March sat at 0.89. Industry fundamentals continued to decline and the bear rally trendline for the Builders Index in Figure 2 was breached on March 5, 2007 (red arrow, far right). Of the 26 builders that make up the index, zero were rated a buy, 22 were rated sell, and four were rated hold by the end of March. This was a big drop from just a month before. FISHING IN A PERFECT STORM... Not only do both indicate that the downtrend is closer to the beginning than the end, economic fundamentals further supported this view. As evidenced by the latest GDP and productivity figures, economic growth was contracting and in a slowing economy, jobs are the next casualty. How could this help spur home sales? While it was not good news for bulls, how would the bears know when to pounce? Other than the VectorVest Builder Index and other charts discussed here, the bears can track the Philadelphia Housing Sector Index (HGX) to follow homebuilders. For lenders, the Dow Jones US Mortgage Finance Index (DJUSMF) provides a good heads-up. CATCHING THE BIG ONE
Contrast this with an election nearing and politicians and government working overtime to keep the economy humming. The preelection year (as in 2007) has traditionally been the strongest year of the four-year election cycle. This means stocks could remain strong, which would be positive for lenders and builders. But while this may delay the inevitable correction, given the underlying fundamentals the longer these stocks rise, the more severe it will be. When the rally is truly over, the bears can always short individual builders and lenders. But are there safer ways to play the downside?
The streetTracks Homebuilders (XHB), an exchange traded fund (ETF) launched in February 2006, is one way. While it also enjoyed the latest bear rally, as markets melted around the globe for a second time in a year on February 27, it also got hammered, dropping through trendline support at $36. It wasn't a good sign for the bulls. Housing futures contracts traded on the Chicago Mercantile Exchange (CME) with contracts for each of 10 cities in the US, plus the CME Housing Composite Index, is another way to play the game. So far, these futures have attracted limited interest as evidenced by the low volume, but as the housing contagion continues to spread, they have the potential to get a lot more popular with builders, investors, and traders looking to hedge real estate (and mortgage) holdings.
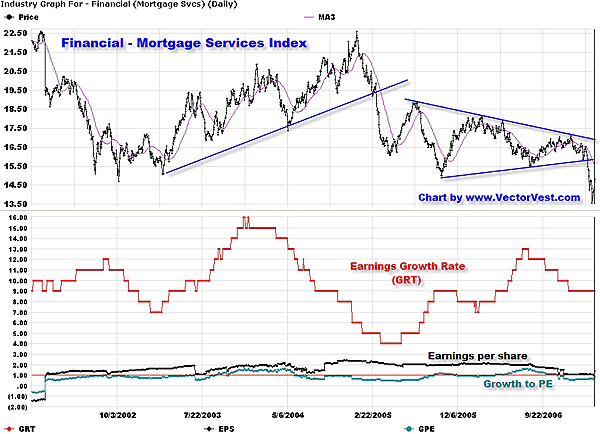
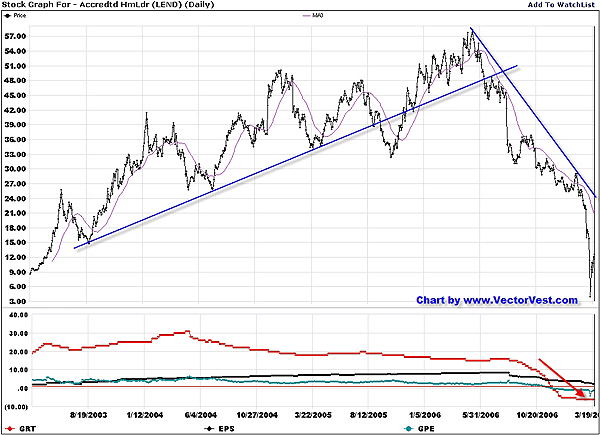
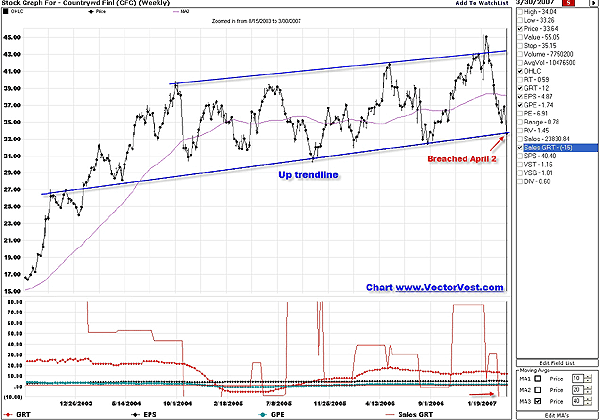
While we have yet to find a subprime mortgage ETF that trades on US markets, we can trade some of the larger lenders like Countrywide Financial (CFC). Although I haven't analyzed them yet, real estate investment trusts (REITs) with a sprinkling of mortgages in their portfolio would be another option. There was even a New Century Financial REIT (NEWC), which was still trading in early April around $0.91. The Vanguard REIT ETF (VNQ) is another possibility, but from the looks of it, it must hold prime mortgages as it was in a strong uptrend as of the first week in April. Not a short candidate yet.
Whatever issue you decide to trade, it's important to use all the tools at your disposal. Traders tend to focus on technicals but they are usually short term, and unless you are looking at longer-term weekly or monthly charts, you can miss the big picture. Fundamental investors, however, blunder into following corporate fundamentals without realizing that often, they only break down after stock prices have already fallen. To get the best view of what is really going on, the most successful traders and investors that this author has had the benefit of knowing and trading with follow both. |
| SUGGESTED READING Live links to related reading http://tradesystemguru.com/content/view/39/9/ - Mortgage crisis hits million-dollar homes (abbreviated link) http://tinyurl.com/27oq36 |
Matt Blackman is a full-time technical and financial writer and trader. He produces corporate and financial newsletters, and assists clients in getting published in the mainstream media. He tweets about stocks he is watching at www.twitter.com/RatioTrade Matt has earned the Chartered Market Technician (CMT) designation.
| E-mail address: | indextradermb@gmail.com |
PRINT THIS ARTICLE

Request Information From Our Sponsors
- StockCharts.com, Inc.
- Candle Patterns
- Candlestick Charting Explained
- Intermarket Technical Analysis
- John Murphy on Chart Analysis
- John Murphy's Chart Pattern Recognition
- John Murphy's Market Message
- MurphyExplainsMarketAnalysis-Intermarket Analysis
- MurphyExplainsMarketAnalysis-Visual Analysis
- StockCharts.com
- Technical Analysis of the Financial Markets
- The Visual Investor
- VectorVest, Inc.
- Executive Premier Workshop
- One-Day Options Course
- OptionsPro
- Retirement Income Workshop
- Sure-Fire Trading Systems (VectorVest, Inc.)
- Trading as a Business Workshop
- VectorVest 7 EOD
- VectorVest 7 RealTime/IntraDay
- VectorVest AutoTester
- VectorVest Educational Services
- VectorVest OnLine
- VectorVest Options Analyzer
- VectorVest ProGraphics v6.0
- VectorVest ProTrader 7
- VectorVest RealTime Derby Tool
- VectorVest Simulator
- VectorVest Variator
- VectorVest Watchdog

