HOT TOPICS LIST
- Strategies
- Stocks
- Buy
- Investing
- Brokers
- Psychology
- Interviews
- Accumulate
- Sell
- Hold
- Spotlight
- Websites
- Candlestick Corner
- Gold & Metals
- Options Trading
LIST OF TOPICS
THE OPTIMIZED TRADER
Moving Average Trios
05/25/07 01:37:58 PM PSTby David Penn
How to use a combination of three moving averages to find the sweet spot in a market move.
| A few years ago, I wrote about stage analysis for Working-Money.com ("Stage Analysis With Trend Channels," December 7, 2005). Later, I had the opportunity to consider another approach to stage analysis, one using a set of moving averages instead of trend channels. This approach was one discussed by David Nassar during a trading presentation called "Foundational Analysis: Selecting Winning Stocks (now available as a TradeSecrets DVD; see my review in the April 2007 issue of Technical Analysis of STOCKS & COMMODITIES magazine.) Nassar used crossovers of moving averages of differing lengths to determine when markets had moved from one stage, such as the accumulation stage, to another, such as what Nassar called the "mark-up" stage. As with Stan Weinstein, whose work informed my 2005 article on stage analysis, Nassar believes not only that there are separate stages of market development, but also that profitable speculation comes from being able to know which stages are the most profitable for trading and which feature risk that is unattractively high. The emphasis is on "risk." Neither Nassar nor Weinstein suggest that accumulation (or "basing" in Weinstein's parlance) can't be profitably traded. Rather, such a stage presents far more challenges compared to other stages — such as the markup (or "advancing" per Weinstein) or declining stages. As the saying goes, you want to have the wind at your back when trading. And waiting until the right stage — one that is clearly advancing or declining — is key to letting the forces of nature, as it were, help you get where you want to go. Nassar put it well when he differentiated stages that "CAN be traded" from markets that "MUST be traded." Consolidating markets represent the former. Trending markets represent the latter. FROM CHANNELS TO TRIOS For example, consider three moving averages: a short-term moving average A, an intermediate-term moving average B, and a longer-term moving average C. Although the specific lengths of the moving averages will become important as traders look to optimize various moving average trios for different markets, for now the important point is that the moving averages be significantly short, intermediate, and longer term relative to each other. Choosing three moving averages that are too similar in duration will limit the ability of the combination of moving averages to paint an accurate picture of whether a market is truly accelerating or decelerating. A strongly advancing market will tend to be one in which all three moving averages are pointed upward. In addition, the short-term moving average should be above the intermediate-term moving average, with the intermediate-term moving average above the longer-term moving average. This is the most bullish of the possible combinations of the three moving averages. Conversely, the most bearish combination of the three moving averages would be one in which all three moving averages are pointed downward with the longer-term moving average on top, the intermediate-term moving average below it, and the short-term moving average lower still.
|
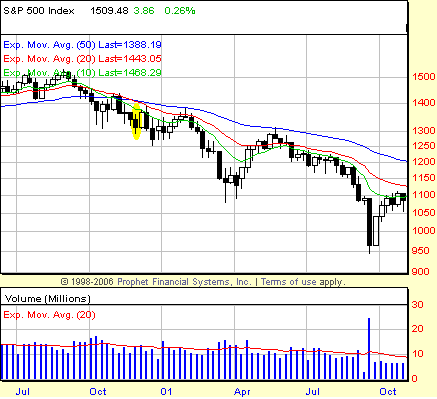
| Markets can advance or decline without the moving averages being in this sort of alignment, of course. But the point is that markets tend to show the greatest momentum when short-term prices outstrip intermediate ones, and intermediate ones outstrip longer-term ones. And while there are a variety of other combinations, we do ourselves a great favor by recalling what Nassar said about differentiating markets that "CAN be traded" from those markets that "MUST be traded." And if we find a market in which its three moving averages (short, intermediate, and long) are in alignment, then we have found a market that not only CAN be traded, but also MUST be traded. Why waste time with the other, suboptimal situations? (See Figure 1.) We can take this thinking a step further. Rather than looking simply for markets in which during advances the short-term moving average is above the intermediate-term moving average and where the intermediate-term moving average is above the long-term moving average, why not focus on that specific moment when the three moving averages move from bearish alignment to bullish alignment? Since it is not necessary that there be some specific order in which the moving averages fall into realignment, all a trader needs to do is set up his or her trio of moving averages and then begin scanning for instances when the three moving averages move from being either out of alignment (intermediate above short above long) into alignment, or from one type of alignment (short above intermediate above long) to alignment in a different direction (long above intermediate above short). Often, taking a position just as the moving averages are snapping into alignment can provide an excellent entry into a market just as it is moving into a "MUST-trade" stage of markup/advancing or decline. MOVING AVERAGE "MUST TRADES" Here are the rules. Look for the session in which the moving averages first come into bullish or bearish alignment. In other words — and using the bullish re-alignment setup as the example — I am looking for the first time the 10-week moving average is above the 20-week while the 20-week EMA is above the 50-week. The high of that session sets the point of entry. This could be reached as soon as the next session (say, next week) or after a few more weeks. Essentially, I am looking for follow-through after the moving averages indicated a change in direction toward the upside. The reverse is true with bearish re-alignment: I am looking for the first time the 10-week moving average is below the 20-week EMA, while the 20-week moving average is below the 50-week. A short entry takes place as soon as the market moves below the low of the session during which the bearish re-alignment first appeared. This method assures that there will be no top-ticking or bottom-feeding as a strategy; the method is as incapable of shorting above the 50-period EMA as it is unable to go long below it. While traders using this approach will occasionally find themselves whipped in or out of a position just as the market is changing direction, the 50-period EMA restriction helps a trader avoid buying falling markets or selling advancing ones.
|
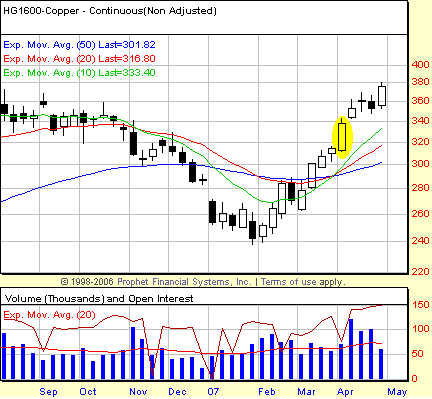
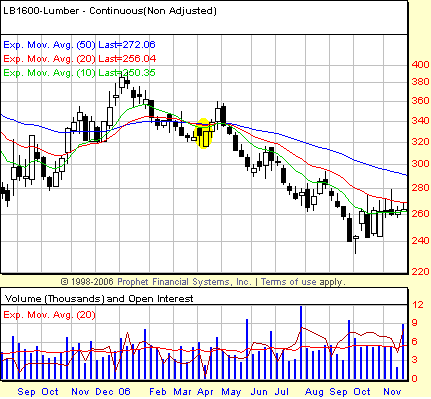
| The first example shows copper, basis continuous futures, over the past nine months (Figure 2). Note how the moving averages slip into bullish realignment in early April after a short correction that saw the shortest moving average dip below the longest. That shift — as of the close of the week beginning April 2 — signaled that speculators could reasonably take long positions if and when the high of that week was exceeded by subsequent price action. That subsequent price action came swiftly during the following week, getting speculators long at 342.50 (as of this writing, copper — basis continuous futures — is trading around 371.50 (a difference of 29 cents or approximately $7,250 per contract). The volume patterns are also interesting in the copper chart. Note how volume spikes during the week of entry (the session immediately after the circled session). That surge in volume was indicative of buyers increasingly convinced that the correction that developed over the December 2006/January 2007 period was over. Another example from the world of commodities takes a look at the bearish alignment — or realignment — of the three moving averages leading to a short signal. Figure 2 is a weekly chart of lumber prices, basis continuous futures, along with the 10-, 20-, and 50-week exponential moving averages. Lumber was in a rally mode as 2005 ended — even though we can tell by the moving averages that the high in late 2005 is likely a lower high (all three moving averages show up on the left side of the chart as "swooping down" as if coming from a higher level). Lumber moved lower into the spring of 2006, with the three moving averages slipping into bearish alignment (that is, 10- below the 20- and the 20- below the 50-) just as lumber is slipping to new, year-to-date lows. (See Figure 3.)
|
| It is a little difficult to determine which week — the week beginning April 3 or the week beginning April 10 — is the one during which the bearish alignment first develops. If the software you are using does not provide a numerical reference for indicators (some note wherever the cursor is placed, while others only note the current session's indicator value), then eyeballing will have to suffice. Here, in the instance of lumber futures, we can simply rely on the lower of the two weeks in question as the threshold below which it is reasonable to go short. Interestingly, the market moves higher initially, tying the moving averages into a tight coil. Shortly thereafter, however, the market moves back downward, creating another bearish alignment. Whether you wanted to trade based on the earlier bearish realignment in April or trade the one that developed in May (which was evident as of the close of the week beginning May 8), both short entries would have served as excellent "on-ramps" for the ride that followed as lumber futures plunged from the 320 level in the spring of 2006 to just north of 240 by the autumn (a drop of 80 points per contract or $8,800). MOVING AVERAGES OF THE MOMENT
|
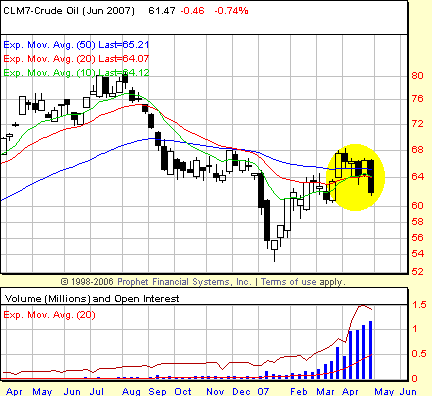
| There are a few, fresh moving average trios in the commodities that are setting up as of this writing — bullish and bearish realignments that have just, or appear about to, develop. One of the more interesting bearish realignments-in-progress is in the weekly chart of crude oil futures (basis June) (Figure 4). Here we have a market that had been a trend trader's dream; you would have to go back to 2003 to find the bullish realignment that triggered crude oil's impressive bull market. More recently, crude oil has been in correction mode, topping out in the summer of 2006 and falling from about $80 (basis June 2007) to as low as $54 by January 2007. There was even a bearish realignment during this correction — specifically in the first half of December 2006 — which set up a profitable short trade when June crude broke down below the 65-64.75 level. Moving deeper into the spring of 2007, it appeared as if crude oil might resume its march higher as the 10-, 20-, and 50-week moving averages leveled off and the shortest moving average, the 10-week, crossed above the 20-week. But both the 10-week and the 20-week remained below the 50-week EMA, a key distinction in this approach. The potential impact of that distinction became clear in the final week of April-first week of May as June crude oil moved sharply lower, dragging both the 10- and the 20-week moving averages lower with it. With the 10-week having crossed above the 20-week in early April, the 10-week is now poised to cross back below the 20-week moving average. And with both moving averages below the 50-week, such a cross is all that would be required for June crude to give a bearish realignment short signal. That signal would then set the low of the week beginning April 30 as the entry point for a trade to the downside in June crude. A follow through weekly close below that level would launch the short trade. A last note for clarification: I refer both to "alignment" and "realignment." By "alignment," I am referring to the status of the trio of moving averages when the shortest is leading, followed by the intermediate term, followed by the longer term — regardless of whether the market is moving upward or downward. By "realignment" I am referring specifically to that instance when a market whose trio of moving averages is not in alignment shifts to become in alignment. "Alignment" is — or, at least, can be — an enduring condition. "Realignment" is a relatively brief process. David Penn may be reached at DPenn@Traders.com. SUGGESTED READING |
Technical Writer for Technical Analysis of STOCKS & COMMODITIES magazine, Working-Money.com, and Traders.com Advantage.
| Title: | Traders.com Technical Writer |
| Company: | Technical Analysis, Inc. |
| Address: | 4757 California Avenue SW |
| Seattle, WA 98116 | |
| Phone # for sales: | 206 938 0570 |
| Fax: | 206 938 1307 |
| Website: | www.traders.com |
| E-mail address: | DPenn@traders.com |
Traders' Resource Links | |
| Charting the Stock Market: The Wyckoff Method -- Books | |
| Working-Money.com -- Online Trading Services | |
| Traders.com Advantage -- Online Trading Services | |
| Technical Analysis of Stocks & Commodities -- Publications and Newsletters | |
| Working Money, at Working-Money.com -- Publications and Newsletters | |
| Traders.com Advantage -- Publications and Newsletters | |
| Professional Traders Starter Kit -- Software | |
PRINT THIS ARTICLE

Request Information From Our Sponsors
- StockCharts.com, Inc.
- Candle Patterns
- Candlestick Charting Explained
- Intermarket Technical Analysis
- John Murphy on Chart Analysis
- John Murphy's Chart Pattern Recognition
- John Murphy's Market Message
- MurphyExplainsMarketAnalysis-Intermarket Analysis
- MurphyExplainsMarketAnalysis-Visual Analysis
- StockCharts.com
- Technical Analysis of the Financial Markets
- The Visual Investor
- VectorVest, Inc.
- Executive Premier Workshop
- One-Day Options Course
- OptionsPro
- Retirement Income Workshop
- Sure-Fire Trading Systems (VectorVest, Inc.)
- Trading as a Business Workshop
- VectorVest 7 EOD
- VectorVest 7 RealTime/IntraDay
- VectorVest AutoTester
- VectorVest Educational Services
- VectorVest OnLine
- VectorVest Options Analyzer
- VectorVest ProGraphics v6.0
- VectorVest ProTrader 7
- VectorVest RealTime Derby Tool
- VectorVest Simulator
- VectorVest Variator
- VectorVest Watchdog


