HOT TOPICS LIST
- Strategies
- Stocks
- Buy
- Investing
- Brokers
- Psychology
- Interviews
- Accumulate
- Sell
- Hold
- Spotlight
- Websites
- Candlestick Corner
- Gold & Metals
- Options Trading
LIST OF TOPICS
OPTIMIZED TRADER
Trading The Stars
07/20/07 11:12:11 AM PSTby David Penn
Morning and evening star patterns in the daily USD/CHF suggest opportunities for candlestick traders in foreign exchange.
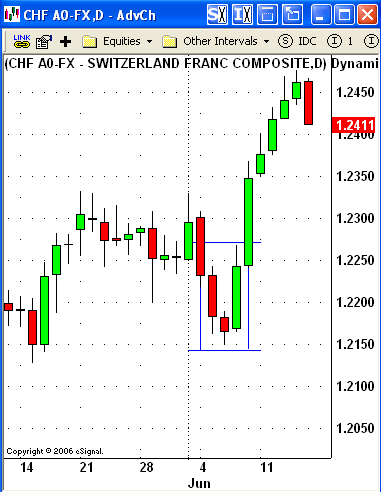
| There may be no better marker of the recent surge in the US dollar than recent price action in the US dollar/Swiss franc currency pair, or USD/CHF. This pair bottomed in late April (which I managed to call in an April 18th article for Traders.com Advantage, "2B Test Of Bottom In The US Dollar-Swiss Franc") and rallied into mid-May. From May until early June, the USD/CHF slid lower from a mid-May peak near 1.2325 to an early June low near 1.2150. It was the combination of an excellent morning star pattern on June 5, 6, and 7 and nearby support from a correction low in the first half of May that allowed that correction to make a bottom. But few could have predicted the sharp rally that followed as the USD/CHF moved almost vertically for the next five sessions, with higher highs and higher lows taking the pair up above the 1.2450 mark. The morning star pattern is one of a number of key reversal patterns in Japanese candlestick charting. As described by Steve Nison, the widely acknowledged expert in candlestick charting, in his book, Japanese Candlestick Charting Techniques, the morning star pattern: is comprised of a tall, black real body followed by a small real body which gaps lower ... the third day is a white real body that moves well within the first period's black real body. This pattern is a signal that the bulls have seized control. Because we are using candlesticks in the context of a forex market that is active 24 hours a day, we have to be less stringent on the requirement that the "small real body" will gap lower. Much of my understanding about the different ways that traders must think about candlesticks when trading spot currencies is due to the discoveries of Nison and his examination of the difference between candlesticks in a forex context and candlesticks in nonforex contexts. This analysis, which makes up a considerable portion of Nison's Profiting In Forex DVD series (reviewed in the August 2007 issue of Technical Analysis of STOCKS & COMMODITIES), is worth listening to for any trader seriously interested in charting and trading spot currencies using candlesticks. At any rate, in looking at the pattern in early June, we can see that it definitely fits the definition of a morning star. June 6 has the market moving lower. In fact, that session looks at first glance to be quite bearish insofar as it takes out the short-term support five days earlier. However, there are a few things that should have cautioned an aggressively short trade, chief among which is that the USD/CHF at that moment was headed into a potential support zone left over from the lows of mid-May. In order to set up a deeper correction, a correction that might have tested the bottom from late April, the USD/CHF would have to first take out the mid-May support. Not only did the USD/CHF fail to do this, but also it formed a small real body on June 7 as support drew closer and failed to close beneath the low of the June 6th session — the low point of which now represented a support level. The third day, June 8, was the true bullish charm as the USD/CHF used that support level to create not just a morning star, but also a bullish engulfing pattern large enough to compass both the June 6th and June 7th real bodies. Truly, a reversal appeared at hand.
|
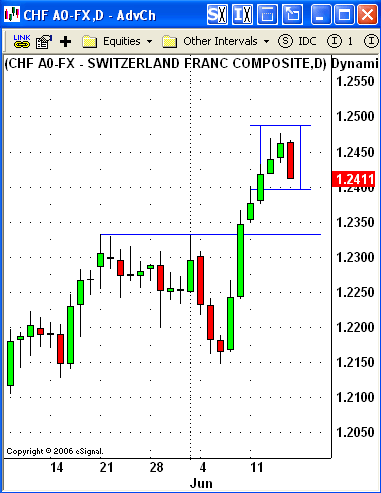
| How might a trader have played the morning star (Figure 1)? The most aggressive way to trade a morning star is to go long on the open following the completion of the pattern, with a stop (mental or physical) at the low of the pattern. Because the open and close in forex are never more than a few pips away from each other (the continuous nature of foreign exchange trading is responsible for that), we can posit an entry near 1.2245. A more conservative approach would be to wait for follow-through by way of a close above the high of the morning star pattern. In this case, we would be looking at an entry significantly higher, more like 1.2350. Steve Nison reminds traders to pay attention to the risk/reward before moving from trading signal to trade execution. Nison's method for assessing risk/reward relies in part on price-defined support and resistance, and applying aspects of his method here will help us compare both the aggressive and conservative approaches to the morning star pattern in early June. The aggressive method saw the trader getting long near 2250, with the nearest support at about 2150. This sets up 100 pips of risk. What is the reward? Looking for the nearest resistance, we find potential resistance in the form of the highs of the second half of May around 1.2325. The risk/reward scenario is then 100 pips of risk versus 75 pips of reward. By contrast, look at the conservative approach. Here, the trader waits for follow-through on a closing basis and gets it as of the close of the session following the morning star. This provides for an entry at about 1.2350. Now, what is the risk? Not at the lows of the morning star, but at the level of the break when the USD/CHF surpassed the highs of May. With potential support at the level of the breakout, about 1.2325, we are now looking at a risk profile that is only 25 pips. What of the reward? Since the May highs are no longer available as an upside target, we need to look at a larger time frame to find recent resistance. That resistance appears in the form of the highs of the second half of February near 1.2437. Putting this number into our risk/reward equation gets us a potential reward of 87 pips. Risking 25 to get 87 represents a better than 3-to-1 ratio of reward to risk. If there are trades you can take and trades you must take, those with a 3:1 reward-to-risk ratio certainly fall into the latter category. As we can see, the USD/CHF exceeded the target on a closing basis three days after the conservative entry. And while the aggressive trader might have made as much money or even more trading from the lower level, he or she would have done so with considerably greater risk compared to the conservative entry. This analysis of trading the morning star takes on additional relevance given the fact that the rally in mid-June appears to have developed an evening star — a pattern that is essentially the opposite of the morning star (Figure 2). So let's examine the evening star and attempt to apply the same rules of risk and reward analysis that were so helpful with regard to the earlier, morning star pattern.
|
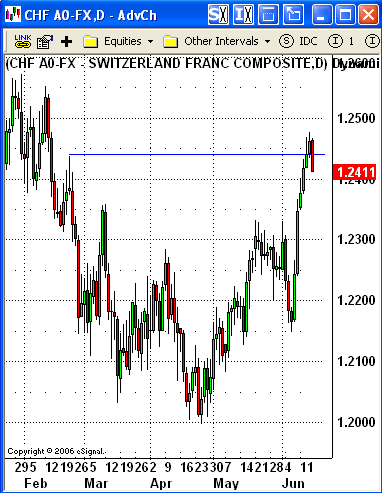
Nison, writing about the evening star pattern, notes:Three lines compose the evening star. The first two lines are a long, white real body followed by a star. The star is the first hint of a top. The third line corroborates a top and completes the three-line pattern of the evening star. The third line is a black real body that moves sharply into the first periods white real body. Arguably, the first line in this evening star is itself a warning of an imminent reversal, given the long shadow at its top suggesting that sellers overwhelmed buyers as the session moved toward the close. In addition, the second line in this evening star is larger than I would prefer, and thus may or may not be a true "star." But there's no fading the bearishness of the third line, which not only opens at or near the highs and closes at or near the lows, but also manages to engulf the prior two bullish lines. We also know, by expanding our view of the price action, that the evening star that developed in mid-June did so as prices for USD/CHF neared a resistance level left over from the second half of February. It is not the most imposing resistance level, established basically because of a single intraday spike in a market that was declining at the time. But USD/CHF showed weakness as it approached this area, and at the end of the day, what is important is not whether the trader believes resistance (or support, for that matter) is credible, but whether price action acts as if the resistance or support level is credible. See Figure 3. The combination of resistance and a reversal pattern such as an evening star provides the backdrop for, again, the aggressive trader to short this market. As was the case with the morning star, the far reaches of the pattern will serve as our stop. Here, the top of the evening star is at about 1.2476 and the low of the third line in the pattern is at approximately 1.2411. Again, because of the way forex works, we can assume that the entry will be only a few pips away from the close of that third line. This means that the risk for a short of the evening star pattern in USD/CHF is approximately 65 pips.
|
| The reward? The most immediate source of potential support comes from the highs of late May near 1.2330. Subtracted from our potential short entry point at 1.2411 gives us a potential reward of 81 pips. This means the risk/reward for shorting at the current level is 65 pips of risk for 81 pips of reward or about 1-to-1.24 ratio. This is not an overwhelmingly impressive risk/reward ratio, although there may be some instances when some traders might be comfortable trading a 1:1.24 risk/reward scenario. This would not be a trade I would be enthusiastic about, in part because of the risk/reward ratio and in part because that subpar risk/reward ratio also has the trader going against the trend of greenback appreciation against the Swiss franc (the European carry trade). Rather, I would be on the lookout for bottoming patterns such as hammer, bullish engulfing, even another morning star, as the prices for the USD/CHF pair drifted closer to a source of potential support and, beyond that, a potential renewal of the bull market in USD/CHF. SUGGESTED READING |
Technical Writer for Technical Analysis of STOCKS & COMMODITIES magazine, Working-Money.com, and Traders.com Advantage.
| Title: | Traders.com Technical Writer |
| Company: | Technical Analysis, Inc. |
| Address: | 4757 California Avenue SW |
| Seattle, WA 98116 | |
| Phone # for sales: | 206 938 0570 |
| Fax: | 206 938 1307 |
| Website: | www.traders.com |
| E-mail address: | DPenn@traders.com |
Traders' Resource Links | |
| Charting the Stock Market: The Wyckoff Method -- Books | |
| Working-Money.com -- Online Trading Services | |
| Traders.com Advantage -- Online Trading Services | |
| Technical Analysis of Stocks & Commodities -- Publications and Newsletters | |
| Working Money, at Working-Money.com -- Publications and Newsletters | |
| Traders.com Advantage -- Publications and Newsletters | |
| Professional Traders Starter Kit -- Software | |
PRINT THIS ARTICLE

Request Information From Our Sponsors
- StockCharts.com, Inc.
- Candle Patterns
- Candlestick Charting Explained
- Intermarket Technical Analysis
- John Murphy on Chart Analysis
- John Murphy's Chart Pattern Recognition
- John Murphy's Market Message
- MurphyExplainsMarketAnalysis-Intermarket Analysis
- MurphyExplainsMarketAnalysis-Visual Analysis
- StockCharts.com
- Technical Analysis of the Financial Markets
- The Visual Investor
- VectorVest, Inc.
- Executive Premier Workshop
- One-Day Options Course
- OptionsPro
- Retirement Income Workshop
- Sure-Fire Trading Systems (VectorVest, Inc.)
- Trading as a Business Workshop
- VectorVest 7 EOD
- VectorVest 7 RealTime/IntraDay
- VectorVest AutoTester
- VectorVest Educational Services
- VectorVest OnLine
- VectorVest Options Analyzer
- VectorVest ProGraphics v6.0
- VectorVest ProTrader 7
- VectorVest RealTime Derby Tool
- VectorVest Simulator
- VectorVest Variator
- VectorVest Watchdog


