

HOT TOPICS LIST
- Strategies
- Stocks
- Buy
- Investing
- Brokers
- Psychology
- Interviews
- Accumulate
- Sell
- Hold
- Spotlight
- Websites
- Candlestick Corner
- Gold & Metals
- Options Trading
LIST OF TOPICS
FOCUS ON
Property Sector Yin And Yang
07/26/07 12:06:20 PM PSTby Matt Blackman
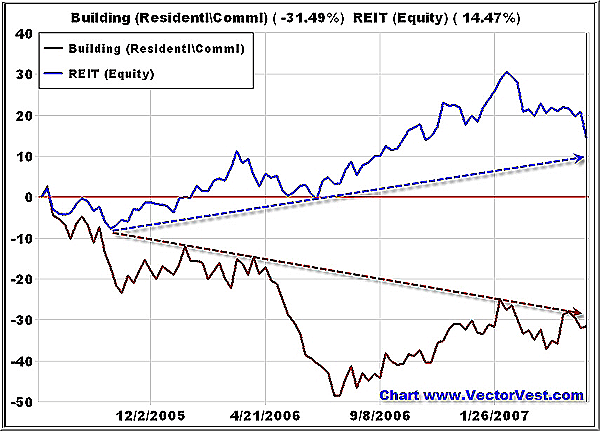
How can the performance of two industries in the same sector be worlds apart?
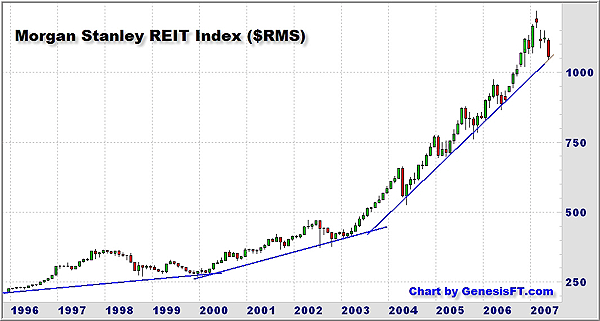
| The residential real estate market is anything but strong. Equity real estate investment trusts (REITs) are flying high. They are both in the same sector, so why is one sucking wind while the other soars? As discussed in my previous article, "Builders, Lenders: Next In the Falling Knife Saga," news about homebuilders and lenders has not been good and since that article was published, the situation has continued to deteriorate. New home sales registered an impressive 16.2% gain in April, but it came at a terrible cost. In many areas, builders have been forced to offer generous incentives to make sales. Median new-home prices were down 10.9% from the previous year, the biggest drop since the Great Depression, according to Bloomberg News. New housing inventories also remain stubbornly high. It was no surprise that after staging a comeback from a 16-year low in September 2006, the National Association of Home Builders (NAHB) Housing Market Index (HMI) survey of more than 300 builders was back again to its previous low of 30 in April. By June the index had dropped to 24. It showed that builders were getting more pessimistic about their industry's future. April was also a bad month for housing permits, another significant leading industry indicator, which dropped 8.9% for the biggest monthly drop in more than 16 years. Permits dropped another 7.5% in June. And the existing-homes market was no better off. Inventories of unsold homes nationwide jumped more than 10% since March, hitting a multiyear high of 8.4 months and home prices were down in 18 of 20 major cities across the country. In June unsold inventories hit 8.9 months. With median home prices up more than 100% between 1999 and 2006, according to the Case Shiller Composite Index, values still had a long way to drop. The subprime mortgage meltdown and resulting credit tightening have only speeded the Mortgage REIT Index's decline. Meanwhile, as the Morgan Stanley REIT Index ($RMS) in Figure 1 shows, equity REITs have been on a tear, up more than 260% since early 2000, and the top-10 52-week REIT performers were up a median 41% in the last year alone. So with the residential real estate market in so much turmoil, why had REITs held up so well?
|
| VIVE LA DIFFERENCE First, mergers and acquisitions (M&A) activity has been fierce. Blackstone Group's $20 billion takeover of Equity Office Property in late 2006, which set a new dollar-value record, effectively opened the door to more large-scale takeovers. The Blackstone deal came just a week after investor Carl Icahn and real estate firm Macklowe put in a $4.6 billion bid for REIT Jackson Associates Realty Corp. Even the Chinese were getting in on the action, buying a $3 billion stake in Blackstone Group. See Figure 2.
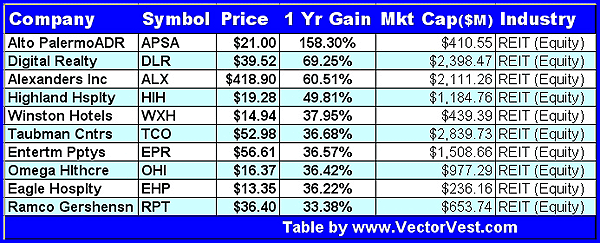
In a recent search for the top-ten 52-week performing equity REITs, three — Highland Hospitality (HIH), Eagle Hospitality (EHP), and Winston Hotels (WXH) — were M&A takeover targets (Figure 3). Previously, the market believed such large firms were thought to be immune to takeover, but with the floods of cash circling the globe looking for value, the Equity Office purchase by Blackstone Group recalibrated the price bar. It is clear that REITs are viewed as cheaply valued.
|
| But the rash of acquisitions totaling well over $115 billion in 2006, up from just $15 billion in 2004, meant that some of the best REITs were being transferred from public to private hands, reducing the selection for retail investors. And as any Economics 101 student can tell you, when supply drops in the face of increasing demand, prices rise. But the real reason for the performance difference had to do with the sector health. While the residential housing market was suffering a hangover from low interest rate excesses of the past four years, commercial demand remained strong, thanks to a robust business sector. Office vacancy rates, especially in places like New York City, were low, pushing lease rates higher. Strong tourism demand thanks to a weaker dollar had boosted hotel stays, and occupancies were up. Another key equity REIT sector, health care, was also doing well, with little slowing in sight given the medical and institutional housing needs of an aging population.
|
| REIT POWER As Robert Toll, the CEO of luxury homebuilder Toll Brothers, said after it was announced that his company's net income declined 79% for the quarter ended April 30, 2007, "I would say that we have not got the bad times behind us yet." Even NAHB spokesman David Seiders admitted after consistently weak Housing Market Index readings that he'd underestimated the severity of the downturn a few months ago. As fallout from the subprime mortgage contagion spreads with a resulting tightening of credit, especially for first-time buyers, it is unrealistic to expect a housing turnaround anytime soon. It's not surprising that equity REITs have cooled down of late. They were due for a rest. What is surprising is how well they have performed in a rising interest rate environment that has been so hard on residential housing. Markets should continue to benefit from increased spending leading into the Presidential election in 2008, and growing numbers of big spenders (45- to 54-year-olds) in the economy will provide powerful support for markets and the economy for the next year. If any real estate sector is to benefit, equity REITs have the best chance. Rather than trying to pick a bottom in the residential real estate market, which has become a popular pastime among analysts and investors of late, equity REITs are worth watching. If interest rates fall or the economy picks up steam, look for this sector to be a leader into the election year. |
| SUGGESTED READING -List of companies in VV Equity REIT industrial group: http://tradesystemguru.com/content/view/60/9/ -Fundamental definitions used http://www.VectorVest.com/definitions -Stocks in the Builders Index http://www.VectorVest.com/builders-lenders -Stocks in the Morgan Stanley REIT Index http://tinyurl.com/yt8wxc |
Matt Blackman is a full-time technical and financial writer and trader. He produces corporate and financial newsletters, and assists clients in getting published in the mainstream media. He tweets about stocks he is watching at www.twitter.com/RatioTrade Matt has earned the Chartered Market Technician (CMT) designation.
| E-mail address: | indextradermb@gmail.com |
PRINT THIS ARTICLE

Request Information From Our Sponsors
- StockCharts.com, Inc.
- Candle Patterns
- Candlestick Charting Explained
- Intermarket Technical Analysis
- John Murphy on Chart Analysis
- John Murphy's Chart Pattern Recognition
- John Murphy's Market Message
- MurphyExplainsMarketAnalysis-Intermarket Analysis
- MurphyExplainsMarketAnalysis-Visual Analysis
- StockCharts.com
- Technical Analysis of the Financial Markets
- The Visual Investor
- VectorVest, Inc.
- Executive Premier Workshop
- One-Day Options Course
- OptionsPro
- Retirement Income Workshop
- Sure-Fire Trading Systems (VectorVest, Inc.)
- Trading as a Business Workshop
- VectorVest 7 EOD
- VectorVest 7 RealTime/IntraDay
- VectorVest AutoTester
- VectorVest Educational Services
- VectorVest OnLine
- VectorVest Options Analyzer
- VectorVest ProGraphics v6.0
- VectorVest ProTrader 7
- VectorVest RealTime Derby Tool
- VectorVest Simulator
- VectorVest Variator
- VectorVest Watchdog