HOT TOPICS LIST
- Strategies
- Stocks
- Buy
- Investing
- Brokers
- Psychology
- Interviews
- Accumulate
- Sell
- Hold
- Spotlight
- Websites
- Candlestick Corner
- Gold & Metals
- Options Trading
LIST OF TOPICS
OPTIMIZED TRADER
TRIX Two Ways, Part I
08/02/07 04:08:31 PM PSTby David Penn
There's more than one way to trade this classic momentum indicator.
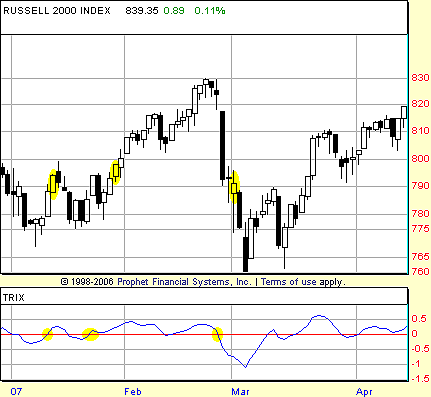
| It's been almost 25 years since traders were first introduced to the triple exponentially smoothed oscillator (TRIX) in the pages of Technical Analysis of STOCKS & COMMODITIES magazine. While there have been a number of ways that technical analysts have modified and tweaked the TRIX for their own purposes since then, many of the original ways that Jack Hutson, the publisher of STOCKS & COMMODITIES and inventor of the TRIX, and others set out for trading the TRIX remain valid and valuable methods for traders. TRIX is found on most charting software packages, both standalone and web-based. Even so, the computation of TRIX is straightforward compared to a number of other momentum indicators such as the stochastic. Essentially, TRIX is derived by taking an initial exponential moving average, then taking an exponential moving average (EMA) of the first exponential moving average, and then taking an exponential moving average of the second exponential moving average. Finally, take this third exponential moving average and calculate a one-day/one–trading session rate of change to get the TRIX value. Because the TRIX oscillates above and below a zero line, one of the most common ways of trading using the TRIX is to get long the market when the TRIX crosses above the zero line and to get short the market when the TRIX crosses below the zero line. Let's take a look at how the TRIX provided buy and sell signals to the Russell 2000 in 2007. We will look to take positions on a confirming close beyond the session when the TRIX buy or sell signal was created. If there is a TRIX buy signal on day 1, we will look to get long on the first session to close above the high of day 1. For the time being, I will look only at the entries provided by the TRIX. Depending on the market — and the instruments traded — there are any number of ways to exit a trade, and it is worth remembering there is no commandment that the same tools used to get a trader into a trade must be used to get him or her out.
|
| Using the Russell 2000 at our test market, we can see that there were two positive crosses in January. The first led, at best, to a breakeven trade. The second, on the other hand, would have seen a trader long around 798 and well-positioned over the course of February that saw the Russell 2000 advance to the 830 level before stalling and reversing. The sell signal produced by a negative cross, a cross below the zero line, came in late February and would have allowed a trader to get short near 791 in advance of the Russell 2000 falling as low as 760 a mere two days later. TRIX trading signals in March and April also provided for excellent opportunities. It is important to note that there were instances — for example in late March — where a TRIX signal was given, but the absence of a confirming close kept the trader out of a losing trade. While confirming closes prevent traders from taking positions sooner than they might want to, waiting for confirming closes provides the trader with a measure of confidence that the trade is more likely to be moving in the anticipated direction. TRIX trading in May and June tended to be less profitable, owing largely to the sideways trading that began in mid-April and continued to characterize the market through the end of June. |
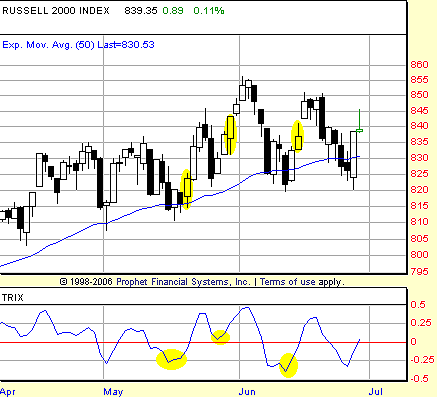
| THE HOOKS HAVE IT While this zero-line crossover technique is a common one with many oscillators, including the TRIX, there is another technique that Hutson revealed in his early TRIX articles that is also worth looking at. In this technique, the focus is not the crossover of the zero line, but simply the "hooking" up or down of the TRIX indicator line. When the TRIX is falling and then develops a small "hook" pointing upward, a TRIX buy signal is created. When the TRIX is rising and then develops a small hook pointing down, a TRIX sell signal is created. Because Hutson made the point that "the very best results seem to come by using the TRIX subroutine to time your entry in a trending market," I have added a 50-day exponential moving average (EMA) to the price chart in Figure 2. TRIX buy signals will only be taken if they occur in sessions closing above the 50-day EMA. TRIX sell signals will only be taken if they occur in sessions closing below the 50-day EMA. This will help give the signals some trend context and, hopefully, weed out ineffective countertrend signals. Let's look at the same first four-odd months of 2007 and see what the hook provides by way of entries compared to the zero crossover. The first bull hook comes accompanied by a hammer candlestick in early January and was good for a quick three-day ride higher before pulling back to the breakeven level. A pair of bull hooks developed in late January, both of which would have been solid entries for the rally that began in February.
|
| Interestingly, the hook method would have not provided any short entry during the Russell 2000's collapse in late February. Arguably, the negative divergence in the TRIX would have alerted traders to, at a minimum, the threat of a correction. But leaving aside for now the issue of divergences — which are an excellent strategy for analyzing potential tops and bottoms in the TRIX and will be discussed in greater detail in part 2 — the hooks method provided no short signal during a significant and sharp decline in the market. At the same time, the hook method did provide a number of profitable trades during May and June, when the zero crossover method of using the TRIX failed to make money. Bull hooks in mid- and late May as well as in mid-June were excellent short-term opportunities. The hook method is one limited not to TRIX, but can be found in other momentum oscillators such as the stochastic as well. George Lane, writing about the stochastic in an article for STOCKS & COMMODITIES, wrote about how traders could use the "reduction in the velocity of movement" in a momentum oscillator as a trading signal in and of itself. For Lane, there were two types of hook: the "hinge" and the "warning." The hinge appeared in the stochastic in the same way that the hook does in the TRIX: as a bending or curving or angling away from the direction the oscillator is moving. In other words, trading signals are derived from either a hinge/hook up in a downward TRIX or a hinge/hook down in an upward TRIX. While the zero-line crossover approach has its strengths, the hooks approach has much to offer the short-term, momentum-oriented trader. As was the case with the stochastic in the BOSO method (see my Working-Money.com article "BOSO" from October 5, 2005), crossover to the zero line can anticipate enduring trends to the upside or downside. Consider again the chart of the Russell 2000 in Figure 1. The TRIX crossed into positive territory in the second half of January, and did not fall meaningfully back into negative territory until late February. In that time, the Russell 2000 rallied from near 800 to as high as 830 and back to below 800. The hook method, on the other hand, is especially geared toward highlighting trading opportunities as soon as there is the slightest wiggle of waning momentum in the oscillator. If you compare the entry signal from the zero-line crossover to the entry signal from the hook, you'll see that while the momentum often runs out quickly after a hook buy or sell signal, the hook signals tend to come sessions before the zero-line crossover signals arrive. While both techniques can be effective, the hook approach is especially helpful for short-term, momentum traders with the discipline to take whatever profits the markets provide. Next time, in the second part of this article, I will look at two other ways of using the TRIX: divergences and with a signal line to reveal golden crosses, dead crosses, and other profitable trading patterns. |
| SUGGESTED READING Hutson, Jack [1983]. "Good TRIX," Technical Analysis of STOCKS & COMMODITIES, Volume 1: 5. Lane, George [1984]. "Lane's Stochastics," Technical Analysis of STOCKS & COMMODITIES, Volume 2: 3. Penn, David [2002]. "TRIX Is For Traders," Technical Analysis of STOCKS & COMMODITIES, Volume 20: March. _____ [2005]. "BOSO," Working-Money.com, October 5. |
Technical Writer for Technical Analysis of STOCKS & COMMODITIES magazine, Working-Money.com, and Traders.com Advantage.
| Title: | Traders.com Technical Writer |
| Company: | Technical Analysis, Inc. |
| Address: | 4757 California Avenue SW |
| Seattle, WA 98116 | |
| Phone # for sales: | 206 938 0570 |
| Fax: | 206 938 1307 |
| Website: | www.traders.com |
| E-mail address: | DPenn@traders.com |
Traders' Resource Links | |
| Charting the Stock Market: The Wyckoff Method -- Books | |
| Working-Money.com -- Online Trading Services | |
| Traders.com Advantage -- Online Trading Services | |
| Technical Analysis of Stocks & Commodities -- Publications and Newsletters | |
| Working Money, at Working-Money.com -- Publications and Newsletters | |
| Traders.com Advantage -- Publications and Newsletters | |
| Professional Traders Starter Kit -- Software | |
PRINT THIS ARTICLE

Request Information From Our Sponsors
- StockCharts.com, Inc.
- Candle Patterns
- Candlestick Charting Explained
- Intermarket Technical Analysis
- John Murphy on Chart Analysis
- John Murphy's Chart Pattern Recognition
- John Murphy's Market Message
- MurphyExplainsMarketAnalysis-Intermarket Analysis
- MurphyExplainsMarketAnalysis-Visual Analysis
- StockCharts.com
- Technical Analysis of the Financial Markets
- The Visual Investor
- VectorVest, Inc.
- Executive Premier Workshop
- One-Day Options Course
- OptionsPro
- Retirement Income Workshop
- Sure-Fire Trading Systems (VectorVest, Inc.)
- Trading as a Business Workshop
- VectorVest 7 EOD
- VectorVest 7 RealTime/IntraDay
- VectorVest AutoTester
- VectorVest Educational Services
- VectorVest OnLine
- VectorVest Options Analyzer
- VectorVest ProGraphics v6.0
- VectorVest ProTrader 7
- VectorVest RealTime Derby Tool
- VectorVest Simulator
- VectorVest Variator
- VectorVest Watchdog


