HOT TOPICS LIST
- Strategies
- Stocks
- Buy
- Investing
- Brokers
- Psychology
- Interviews
- Accumulate
- Sell
- Hold
- Spotlight
- Websites
- Candlestick Corner
- Gold & Metals
- Options Trading
LIST OF TOPICS
THE OPTIMIZED TRADER
TRIX Two Ways, Part II
08/24/07 04:43:22 PM PSTby David Penn
Trading divergences, golden crosses, and falls with the classic momentum indicator. Installment 2 of two.
| My last discussion on the TRIX or triple-smoothed exponential oscillator covered two of its popular applications: bullish and bearish crossovers involving the zero line, and "hooks" when the TRIX curled up or down. Crossovers, generally speaking, provide particularly valuable signals on the intermediate level. Hooks tend to be most effective for catching short-term shifts in market momentum. There are two other important ways that momentum traders can use the TRIX. The first involves positive and negative divergences, while the second involves using a second line, a signal line that is a derivative of the TRIX, in order to spot key patterns that signal growing or waning momentum. Divergences are a fairly common topic, so let's begin with TRIX divergences. As with divergences in other momentum indicators like the relative strength index (RSI), stochastics, or the moving average convergence/divergence histogram (MACDH), divergences in the TRIX occur when the indicator fails to track price action when higher highs and lower lows are made. Specifically, when a market makes a higher high and the TRIX makes a lower high, then a divergence, a negative divergence, has occurred. When a market makes a lower low and the TRIX makes a higher low, then a positive divergence has occurred. There are other divergence patterns, many of which I described in an article for Working-Money.com last year ("Dial %91D' For Divergences," Working-Money.com, March 8, 2006). But for now, let's stick with the basic, most common, positive and negative divergence scenarios.
|
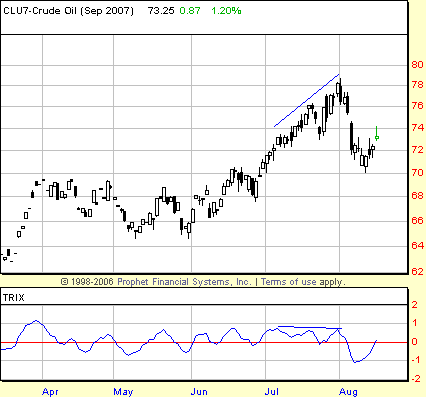
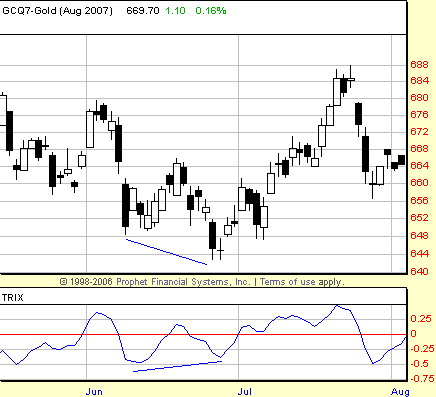
| Note the chart of September crude oil futures in the summer of 2007 in Figure 1. After sideways trading for much of the spring, crude oil futures broke out in early July, rallying $8 per barrel from the beginning of the month to the end. As an aside, the consolidation pattern in the spring, from April to late June, measured approximately $7 at its widest point. Breaking out at approximately $70, September crude did an excellent job of reaching its price projection based on the width of the consolidation that preceded the breakout. In any event, as September crude rallied higher in July, the TRIX indicator began to lag, creating lower highs at the same time that crude oil was creating higher highs. This is the pattern of a negative divergence in the TRIX. I've come to believe that these sort of negative divergences at the tops of markets are more news for bulls than they are for bears. Advancing markets often make a number of negative divergences before they reach their ultimate peak. Negative divergences serve most effectively as warnings that upside momentum is waning. That is not the same thing as a sell signal, though many traders will treat it as such. That doesn't mean that negative divergences cannot be sold. It simply means that a negative divergence in and of itself is not necessarily the best reason to take a new position against that particular market. It is, however, a good reason for someone who is long a market that develops a negative divergence to consider taking profits or reducing risk exposure in the event that the negative divergence does turn out to mark a larger correction or even outright reversal. Let's look at an example of a positive TRIX divergence (Figure 2).
|
| Here we have a market in bearish mode, with lower lows going into and through June. However, as August gold was making lower lows in late June, the TRIX was making higher lows. This is a classic positive, or bullish, divergence. Note also how the TRIX crosses above the zero line shortly after the positive divergence, a bullish sign that further supports the case for higher prices in gold. After a brief, post-positive divergence pullback in the first few days of July, August gold is on the move higher, rallying from a late June low near 644 to a late July high of more than 684. I'll say again that I tend to look at divergences initially as a warning to those with positions in the direction of the trend that has just been challenged by the divergence. For those who trade divergences as reversals, however, there are some helpful rules to make the most out of such trades. First, the low point of a positive divergence or the high point of a negative divergence needs to be the Amityville Horror "Get Out!" point. As I mentioned, trending markets will create multiple divergences en route to their ultimate tops or bottoms. One way to avoid getting killed trying to fade these trends by betting on the divergences is to make sure that there is a clear tap-out point. As such, trading divergences means giving markets a great deal of wiggle room — at least in the beginning. Note how the gold market in Figure 2 bounced immediately after the positive divergence to north of 660, but then pulled back to as low as 648. A stop that was too tight would have prevented a trader from exploiting the true value of the positive divergence, which was the larger move that unfolded over the course of July. Again, when divergences are successful, they are often intermediate-term developments (that is, a month or more on the daily charts). A wider than usual stop, particularly in the beginning, can help a trader take maximum advantage of this. CROSSES AND FALLS In the same way that Japanese traders have enhanced our ability to read price charts with the use of Japanese candlestick charting, so have Japanese traders improved upon the notion of indicators and signal lines to spot certain patterns that can help traders anticipate the sort of crosses between indicators and signal lines that often result in significant price moves. The combination of signal lines and the patterns I will discuss is a particularly winning one that traders who use crossover-based trading systems should consider. With the crossing of the TRIX (or any indicator) and its signal line, there are four main patterns, two of which trigger trader action. These patterns are called golden crosses, dead crosses, bounces, and falls. Golden crosses occur when the TRIX moves through the signal line heading upward in a bullish direction. Dead crosses, by contrast, occur when the TRIX moves through the signal line heading downward in a bearish direction. Bounces occur when the TRIX hooks upward after at least one downward session. Falls occur when the TRIX hooks downward after at least one upward session. Trading with these patterns, although applicable to intermediate-term trading, is especially geared toward shorter-term, momentum-oriented trading. As such, while traders are encouraged to take positions on golden crosses with the TRIX breaking out above the signal line, traders are also encouraged not to wait around for a dead cross in order to exit. Rather, exiting on the fall after a golden cross is recommended instead. Traded in the short term, a position could lose substantial value if a trader kept the position long enough for the TRIX to actually cross below the signal line. The shift in momentum displayed by the fall is sufficient for profit-taking or, at a minimum, reducing exposure.
|
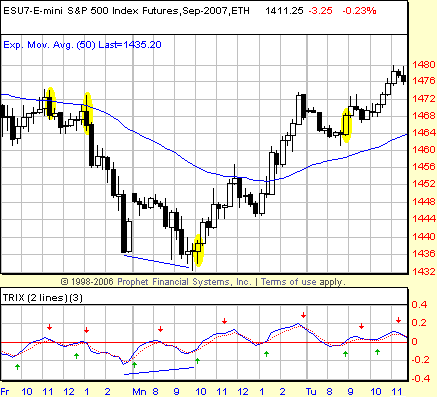
| One of the nice things about Prophet Financial System's implementation of the TRIX with two lines is that it draws green and red arrows to indicate where golden crosses and falls (respectively) appear. This isn't necessary; eyeballing the chart is sufficient. But having the arrows in place not only helps traders learn how to spot these patterns in any crossover situation whether or not the TRIX itself is used, but it also makes it easy to see buy and sell opportunities with a single glance. The chart of the September emini Standard & Poor's 500 futures contract in Figure 3 gives us a number of things to look at. I have included a 50-period exponential moving average (EMA) to put a bit of a filter on the TRIX trades; no long trades below the 50-period EMA and no short trades above it — unless there is a negative or positive divergence. Generally, when I am using this setup, I require divergence confirmation from the moving average convergence/divergence histogram instead of relying solely on TRIX divergences. But that is just my personal preference. I have been following this emini S&P 500 daytrading system on and off for the past year or so, and regularly since June. I have been impressed with its results. Because the system involves some strict money management — and because I suspect that money management has been critical to the system's success — I won't spend a lot of time on the system per se, save for using it to show how buying golden crosses and selling falls can be part of a winning technical trading method. On the left side of the chart we have two sell/short signals. In both instances, a TRIX that was rising, however temporarily, turned or hooked down. Because the market was trading under the 50-period EMA, both instances represented sell/short opportunities. On the far right side of the chart, we see a highlighted oval that represents a golden cross and a buying opportunity. Remember that golden crosses develop when the TRIX rallies and crosses above the signal line. Finally, I want to point out the highlighted oval in the center. Here we have a buy signal — as shown by the green arrow that indicates a golden cross has occurred — however, the market is trading below the 50-period EMA. No trade? Au contraire, mon frère! Note that just before the TRIX made its golden cross, the indicator developed a positive divergence, making a higher low at the same time that the market was making a lower low. This is one of the few times I would bet in favor of a market that was trading below the 50-period EMA: when a positive divergence signals waning momentum to the downside. The same would be true in the case of selling a market that was trading above the 50-period EMA: no divergence, no trade. I mentioned that certain TRIX techniques, such as zero line crossovers and divergences, seemed to indicate best over the intermediate term. By contrast, TRIX techniques like the hook were good fits for short-term trading. I would put the golden cross/fall methodology in the short-term trading camp as well. Although the entries provided by this method, as those with the hooks, can be used by longer-term traders and even trend traders to initiate positions, my own experience has found the hooks discussed in part I of this two-part series and the golden cross/fall technique shown here to do as good a job as any other indicator or method in spotting short-term shifts in momentum that may or may not result in larger moves, but certainly, in the short term, are often replete with opportunity for the nimble trader. |
| SUGGESTED READING Hutson, Jack [1983]. "Good TRIX," Technical Analysis of STOCKS & COMMODITIES. Penn, David [2007]. "TRIX Two Ways, Part I," Working-Money.com, August 2. _____ [2006]. "Dial %91D' For Divergences," Working-Money.com, March 8. _____ [2002]. "TRIX Is For Traders," Technical Analysis of STOCKS & COMMODITIES, Volume 20: March. + Prophet Financial |
Technical Writer for Technical Analysis of STOCKS & COMMODITIES magazine, Working-Money.com, and Traders.com Advantage.
| Title: | Traders.com Technical Writer |
| Company: | Technical Analysis, Inc. |
| Address: | 4757 California Avenue SW |
| Seattle, WA 98116 | |
| Phone # for sales: | 206 938 0570 |
| Fax: | 206 938 1307 |
| Website: | www.traders.com |
| E-mail address: | DPenn@traders.com |
Traders' Resource Links | |
| Charting the Stock Market: The Wyckoff Method -- Books | |
| Working-Money.com -- Online Trading Services | |
| Traders.com Advantage -- Online Trading Services | |
| Technical Analysis of Stocks & Commodities -- Publications and Newsletters | |
| Working Money, at Working-Money.com -- Publications and Newsletters | |
| Traders.com Advantage -- Publications and Newsletters | |
| Professional Traders Starter Kit -- Software | |
PRINT THIS ARTICLE

Request Information From Our Sponsors
- StockCharts.com, Inc.
- Candle Patterns
- Candlestick Charting Explained
- Intermarket Technical Analysis
- John Murphy on Chart Analysis
- John Murphy's Chart Pattern Recognition
- John Murphy's Market Message
- MurphyExplainsMarketAnalysis-Intermarket Analysis
- MurphyExplainsMarketAnalysis-Visual Analysis
- StockCharts.com
- Technical Analysis of the Financial Markets
- The Visual Investor
- VectorVest, Inc.
- Executive Premier Workshop
- One-Day Options Course
- OptionsPro
- Retirement Income Workshop
- Sure-Fire Trading Systems (VectorVest, Inc.)
- Trading as a Business Workshop
- VectorVest 7 EOD
- VectorVest 7 RealTime/IntraDay
- VectorVest AutoTester
- VectorVest Educational Services
- VectorVest OnLine
- VectorVest Options Analyzer
- VectorVest ProGraphics v6.0
- VectorVest ProTrader 7
- VectorVest RealTime Derby Tool
- VectorVest Simulator
- VectorVest Variator
- VectorVest Watchdog


