

HOT TOPICS LIST
- Strategies
- Stocks
- Buy
- Investing
- Brokers
- Psychology
- Interviews
- Accumulate
- Sell
- Hold
- Spotlight
- Websites
- Candlestick Corner
- Gold & Metals
- Options Trading
LIST OF TOPICS
Bottoms, Breakouts, And Bear Patterns
09/06/07 01:17:56 PM PSTby David Penn
Divergences, stars, engulfing patterns, and BOSO plays abound in three and a half months of price action in September lumber.
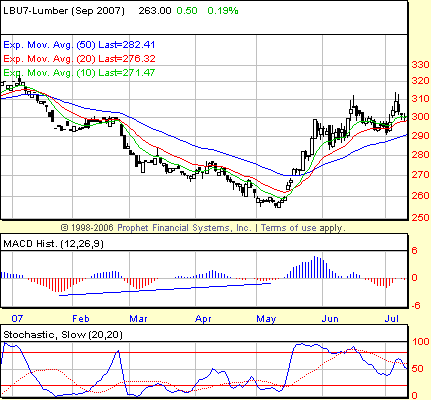
| As Steve Nison once quipped of technical indicators, "The more the better." While technicians will likely differ on when "more" becomes "too much," there is much to be said about using multiple indicators and technical tools to confirm buying and selling opportunities in markets. For me, that suite of tools includes the moving average convergence/divergence histogram (MACDH), the slow stochastic, a set of three exponential moving averages (EMAs), and -- important to note -- Japanese candlestick patterns. I have found this set gives me opportunities to spot tops and bottoms courtesy of the candlestick patterns and the MACDH, opportunities to exploit trending markets early, thanks to the stochastic using the buy overbought-sell oversold (BOSO) methodology, and awareness of larger trend changes due to the arrangement and rearrangement of the three exponential moving averages (EMAs). The MACDH also gives me short-term, swing opportunities that are helpful once markets are in motion. The chart of September lumber shows how helpful these tools have been (Figure 1). Note that the bottom in September lumber occurred in May and was signaled by positive divergences in both the MACDH and the stochastic. We can also tell by the alignment of the moving averages that the downtrend is a mature one. How so? Not only is the shortest moving average the 10-day, lower than the two other, longer-term moving averages, but also the three moving averages are in perfect bearish alignment with the 20-day EMAs below the 10-day but above the 50-day. This bearish alignment of the three moving averages had been in effect for more than three months before lumber bottomed in mid-May.
|
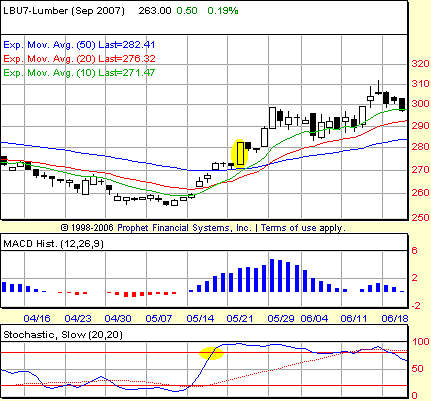
| The buy signal arrived in the first half of that month; actually, there was an even earlier buy signal in late April based on the same sort of positive divergences. These divergences became even more acute in May, and shortly after the divergence-based buy signal in May (signal on May 3, fill on May 7), the long trade in lumber was on at roughly 259.30. Days after the positive divergence buy confirmation, the BOSO stochastic provided another buy signal and confirm. It occurred in mid-May, just as the September lumber contract cleared the 50-day EMA to the upside. Priced at the end of day on the confirmation day, the BOSO called for a long entry at approximately 282.30. By this time, lumber futures were moving higher rapidly. This is just when the BOSO method truly shines. As I have written many times, the best opportunity to buy a market is often just as that market is becoming overbought, just as the best opportunity to sell a market is often just after that market becomes oversold. This BOSO trade in September lumber is another example of this pattern at work. Within five days, September lumber was trading 10 points above its BOSO entry. (See Figure 2.) This rally was accompanied by a towering MACD histogram, which signaled that the price highs of late May would be exceeded before any significant correction developed. This is another of my favorite tricks with the MACD histogram. Although it is not infallible, MACD histogram extremes tend to do an excellent job of anticipating further price movement in the direction of the extreme (that is, extreme peaks = bullish, extreme troughs = bearish).
|
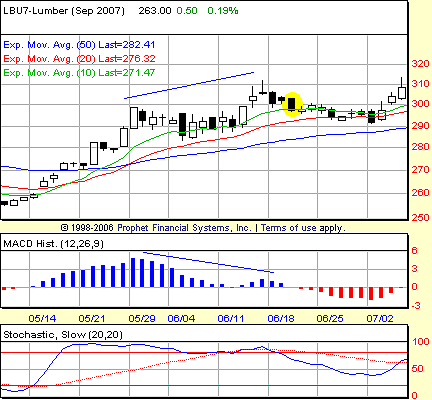
| True enough, after moving sideways for a few days going into mid-June, September lumber was bid higher again -- high enough, as anticipated, to take out the high established during the MACD histogram peak in late May. However, in doing so, September lumber carved out a clear negative divergence in the MACD histogram. In fact, this negative divergence was confirmed by the stochastic as well. To top it off, September lumber formed a shooting star candlestick line -- a bearish reversal pattern -- at the same time. If ever there was a warning to get out of September lumber, these various patterns provided it. I am not necessarily a huge fan of shorting negative divergences that appear at market tops (for reasons I'll point out in a moment). However, the leverage in futures is such that a short-term swing short, a trade designed to last between three and five days, can be a profitable way to exploit a negative divergence that may or may not indicate an enduring top. For example, let's look at the negative divergence trade in September lumber in late June. Based on both the MACD histogram and the stochastic, the negative divergence trade was signaled on June 18 and confirmed on June 20 end of day, at a level of 297.30. Buyers kept the market aloft for a few days, with an intraday print as high as 300.50 on June 22. But two days after that print, September lumber was closing at 293.80 and four days later still another two points were taken off. With a gain of roughly $605 per contract, most traders would have taken at least something off the table before the market began bouncing in early July. See Figure 3.
The bounce in July, however, reaffirmed the caution about shorting tops based on negative divergences. September lumber went on in July to make a higher closing high vis-a-vis June in the first half of the month and, after a brief pullback, an even higher high (on a closing basis) in the second half of the month. In doing so, September lumber still failed to bring the indicators with it, as higher highs in lumber futures were met by lower highs in both the stochastic and the MACD histogram. This again set up short-term shorting opportunities. Per my methodology, the first negative divergence in July would not have been tradable due to an absence of downside follow-through on a closing basis. But the second one occurring in the second half of the month certainly was. Not only was that divergence in the second half of July tradable, but also the session that signaled the negative divergence was itself a particularly bearish engulfing pattern -- one that swallowed up the past three days' worth of upside. Confirmation for the negative divergences and the bearish engulfing pattern fell on the same day, namely the close of the following session at a level of about 293.40. The market bobbed around for a few days after that entry, with an intraday print of as high as 297. But the resistance provided by the gap down on July 18 held, and the market for September lumber began breaking down shortly thereafter. Three days after that intraday print north of 297 (that session, by the way, closed at a much more modest 293.50), September lumber was closing at 283.40. Five days after that intraday print, September lumber was closing at 276.50. Let's not get too far ahead. In the same way that traders were able to exploit an overbought market to the upside using the stochastic, traders were able to ride the lumber market lower in the second half of July, thanks to the oversold stochastic. In this case, the BOSO entry to the short side was signaled on July 20 and confirmed on July 25 with an end-of-day print of 286.80. Five days later, September lumber was closing at 274.50.
|
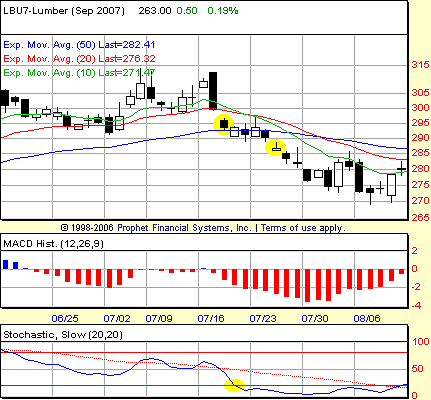
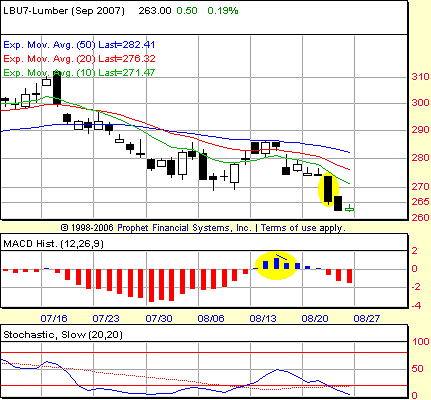
| Note again, as September lumber was breaking down, how a sizable MACD histogram trough was developing. That trough represents a contract low for September lumber, easily qualifying for the sort of MACDH trough extreme we noted previously as a bearish sign. In addition, one of the characteristics of these extreme peaks and troughs is that there is often a pullback (in the case of peaks) or a bounce (in the case of troughs) that often affords an excellent entry opportunity for traders looking to play MACDH extremes. That was the case when the September lumber contract pulled back in early June following the MACDH peak in late May. And so far, it appears to be the case with the MACDH trough in late July. See Figure 4. The post-MACDH trough extreme arrived in the first half of August. This bounce took September lumber futures all the way up from, roughly 270 to resistance at the 50-day EMA near 286. There was a mild short-term positive divergence in both the MACDH and the stochastic. The MACDH divergence would have provided the earlier signal, but the positive divergences in both indicators would have been confirmed as of the end of trading on August 9 at the 278.20 level. With an eye toward the likelihood that any bounce in September lumber would have potentially significant resistance at the 50-day EMA, this would have been a decently profitable trade after just three days. Undertaking such a trade without due respect to the possibility of a bounce meeting resistance at the 50-day EMA would be folly. Assuming a trader paid the proper respect to that potential for resistance, there is a good chance that the gap down that occurred after that resistance level was tested for a third consecutive time would have taken place without taking the long-side trader's money with it. Was this gap down a price move to be traded? We knew from the MACD histogram trough extreme in late July that the lows of late July and early August would be exceeded. This meant there was a good chance that the gap down on August 16 would lead, at a minimum, to the 270 level. The gap down was sufficient in and of itself to create a short signal in the MACD histogram -- a signal that was not confirmed until four days later, when lumber futures broke down to fresh lows (arguably, the day before featured a close that was sufficiently low to be treated as downside follow-through, but I'll use the more conservative case involving the session that unequivocally confirmed the short signal). Short as of the end of day on August 22 at 265.50, as of this writing, September lumber is trading at 262.30.
In addition, the BOSO stochastic provided another entry as the lumber market became oversold as of the close on August 22. With significant follow-through to the downside in the form of a lower closing low, that BOSO short signal was confirmed as of the end of day on August 23. See Figure 5. So you're short and wondering what to do next. Two things should be foremost in mind. The first is the swiftly approaching May lows near 256. It is highly likely that even if these lows are exceeded on a first attempt, some short-covering will keep lumber prices from falling as low as they might, given the temptation of new, contract lows. The closer those May lows come, the more cautious the short-side trader should be. A related concern is the possibility that lumber futures will develop a positive divergence, particularly in the MACD histogram. At this point, whenever I see a MACDH extreme, I start looking for the possibility of a divergence. Divergences anticipated the slowing down of the lumber rally in June, as well as the reversal and collapse following the positive divergence in mid-July. Although bottoms form without the benefit of divergences, it remains well worth our while to watch for them in such markets as these, where divergences have proved telling in the recent past. |
| SUGGESTED READING Penn, David [2007]. "Trading The Stars," Working-Money.com. July 20. _____ [2007]. "Moving Average Trios," Working-Money.com. May 25. _____ [2006]. "Trading The MACD Histogram, Part II," Working-Money.com. December 29. _____ [2006]. "Trading The MACD Histogram, Part I," Working-Money.com. December 6. _____ [2006]. "Dial D For Divergences," Working-Money.com. March 8. _____ [2005]. "BOSO," Working-Money.com. October 5. |
Technical Writer for Technical Analysis of STOCKS & COMMODITIES magazine, Working-Money.com, and Traders.com Advantage.
| Title: | Traders.com Technical Writer |
| Company: | Technical Analysis, Inc. |
| Address: | 4757 California Avenue SW |
| Seattle, WA 98116 | |
| Phone # for sales: | 206 938 0570 |
| Fax: | 206 938 1307 |
| Website: | www.traders.com |
| E-mail address: | DPenn@traders.com |
Traders' Resource Links | |
| Charting the Stock Market: The Wyckoff Method -- Books | |
| Working-Money.com -- Online Trading Services | |
| Traders.com Advantage -- Online Trading Services | |
| Technical Analysis of Stocks & Commodities -- Publications and Newsletters | |
| Working Money, at Working-Money.com -- Publications and Newsletters | |
| Traders.com Advantage -- Publications and Newsletters | |
| Professional Traders Starter Kit -- Software | |
PRINT THIS ARTICLE

Request Information From Our Sponsors
- StockCharts.com, Inc.
- Candle Patterns
- Candlestick Charting Explained
- Intermarket Technical Analysis
- John Murphy on Chart Analysis
- John Murphy's Chart Pattern Recognition
- John Murphy's Market Message
- MurphyExplainsMarketAnalysis-Intermarket Analysis
- MurphyExplainsMarketAnalysis-Visual Analysis
- StockCharts.com
- Technical Analysis of the Financial Markets
- The Visual Investor
- VectorVest, Inc.
- Executive Premier Workshop
- One-Day Options Course
- OptionsPro
- Retirement Income Workshop
- Sure-Fire Trading Systems (VectorVest, Inc.)
- Trading as a Business Workshop
- VectorVest 7 EOD
- VectorVest 7 RealTime/IntraDay
- VectorVest AutoTester
- VectorVest Educational Services
- VectorVest OnLine
- VectorVest Options Analyzer
- VectorVest ProGraphics v6.0
- VectorVest ProTrader 7
- VectorVest RealTime Derby Tool
- VectorVest Simulator
- VectorVest Variator
- VectorVest Watchdog