

HOT TOPICS LIST
- Strategies
- Stocks
- Buy
- Investing
- Brokers
- Psychology
- Interviews
- Accumulate
- Sell
- Hold
- Spotlight
- Websites
- Candlestick Corner
- Gold & Metals
- Options Trading
LIST OF TOPICS
THE CHARTIST
Chasing The Trend With Indicators
09/12/07 03:25:54 PM PSTby Chaitali Mohile
Previously, I discussed various types of moving averages. This time, I will discuss how to identify trends and apply indicators so you can trade successfully.
| I like to trade trends using moving averages (MAs) and other trend identification tools and price momentum indicators. In my last article for Working-Money.com, I wrote about using moving averages and the different kinds of moving averages. This time, I want to discuss how to identify the trends and apply indicators so you can trade profitably. IDENTIFYING TRENDS
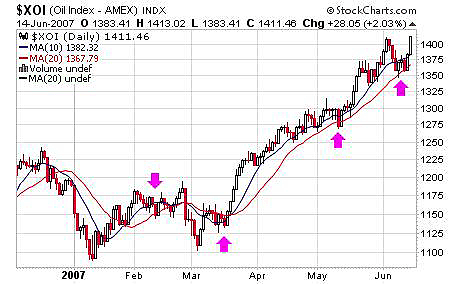
The time span used will differ from trader to trader. Some traders may use only a 200-day moving average and a 50-day moving average for viewing the market, while others may use the 50-day MA and the 20-day MA. One disadvantage of using moving averages in isolation is that you may see a lot of whipsaws resulting in false signals. To avoid whipsaws I prefer to use trend indicators like the average directional movement index (ADX) and Aroon with moving averages. I also draw trendlines if necessary to help me identify market direction. I also like to use the relative strength index (RSI) and the moving average convergence/divergence (MACD). I find it easier to identify intermediate-trend reversals when I use this combination of technical tools. THE ADX In his book How To Make Money Trading Derivatives, Ashwani Gujral interpreted the ADX in a simplified and easy form: The possibility of false signals occurring when applying the ADX is highly likely, particularly in a range-bound move. Keep in mind that when the ADX is at overheated levels, you should only take profits when the indicator starts to decline. This is because the indicator can stay at the 55-60 level for an extended period of time. |
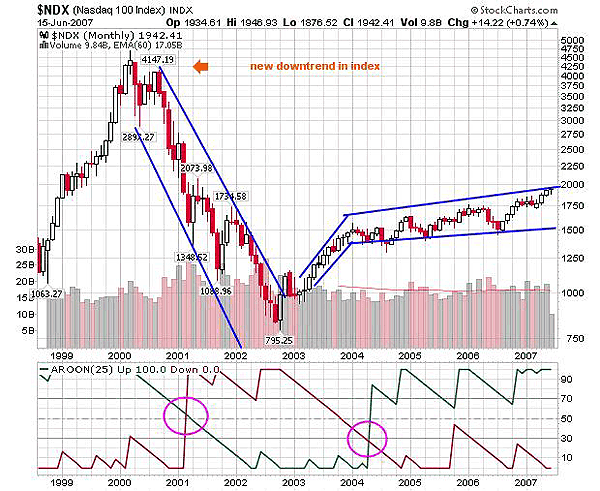
| AROON Analyst Tushar Chande developed this single parameter oscillator in the mid-1990s. Aroon is also a trend indicator with its independent features, weighted in between zero and 100; Aroon up and Aroon down are used to identify the trend. Chande made a calculation taking time period and the highest and lowest close into consideration to identify trends. Like ADX, Aroon indicates the trend phase. According to Aroon, a trend above the 70 level is stronger and a trend below 30 indicates a reversal situation. If Aroon up and Aroon down start moving close to each other, there is a consolidation impending.
In Figure 2, Aroon down moved above Aroon up in 2001, starting the bearish trend. The downtrend turned stronger as Aroon down moved above 70 and Aroon up slipped below 30. This bear market continued for three years, finally giving a reversal signal in 2004. Here is something I would like to point out about the Aroon oscillator. Aroon up moved above Aroon down in 2004, whereas price already moved out of the correction area in early 2003. Due to this late signal, many traders may have missed an opportunity to enter a long position in the preliminary stages. In Figure 2, I have drawn trendlines for supporting indications. Lower highs and lower lows are joined to form support & resistance trendlines. Toward the latter half of 2002, you can see that prices rode along the upper trendline, increasing the significance of the trendline. Such retesting of trendlines indicates that line is about to get violated. That would have been seen as a cautious time, and the trend could have reversed at any point. The upper trendline was finally breached and the index consolidated above the trendline. This gave the hint of a fresh bull trend. The index rallied about 500 points and entered a narrow range-bound phase. The range-bound move turned out to be a broadening channel which, as of this writing, has yet to be violated. The breakout through such a broadening channel may lead to a fast pullback rally. |
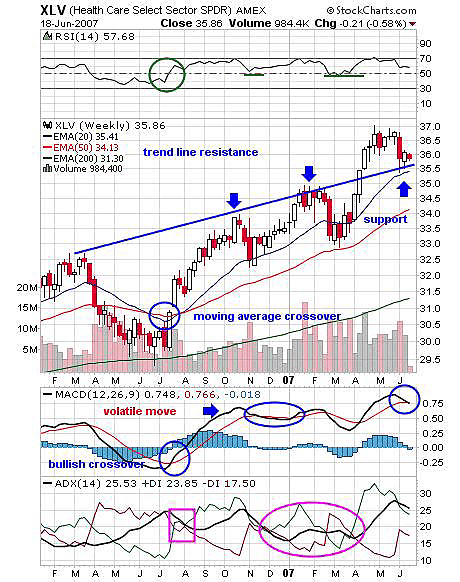
| IMPORTANCE OF MOVING AVERAGES Moving averages are the basic tools I apply to my chart reading. I have found moving averages along with the RSI, (14), the MACD (12, 26, 9), and the ADX to be the most reliable combinations. This avoids most of the whipsaws and makes it easy to understand the movement of stock prices.
Figure 3, the Health Care Select Sector SPDR (XLV), shows how these combinations can be applied. The 14-period relative strength index (RSI) is used to get an idea of the strength that is prevailing in the market. The bullish overlay of the exponential moving averages (EMAs) shows the existence of an uptrend. The upward sloping trendline also indicates an uptrend. The MACD (12, 26, 9) shows various bullish/bearish crossovers and signals possible trades. And the ADX shows the strength of the existing trend. XLV gave its first buy signal in mid-July 2006 when the 20-day EMA moved above the 50-day EMA. The other three indicators confirmed this buy signal. The RSI gave a buy signal when it was above 50 and a sell signal when it went below the 50 level. In Figure 3, the RSI (14) moved above 50 from a lower level of 30, the MACD (12, 26, 9) shows a bullish crossover, and the ADX (14), after a tough battle between the bulls and bears, was taken over by the bulls. The possibility of a trade failure was reduced with this confirmation. After this breakout the trendline drawn reacted as resistance and price retraced first to the 20-day EMA and then to the 50-day EMA. But since all three indicators remained strongly bullish, I would keep my stop-loss on this trade below the 50-day EMA support. In April 2007, XLV violated the trendline resistance, making its strong support now. At this moment I would keep a firm stop-loss below the 20-day EMA, as the MACD (12, 26, 9) may give a bearish crossover. Although the ADX (14) indicates a strong uptrend, it is declining, and the RSI (14) is neutral above 50. From this example you can see how selecting the correct indicators for any given market is a necessity. Only then can you protect yourself from any trading fiascos. |
| SUGGESTED READING Mohile, Chaitali [2007]. "Chasing The Trend With Moving Averages," Working-Money.com, August 29. Charts by StockCharts.com |
Chaitali Mohile is an active trader in the Indian stock markets. She may be reached at chaitalimohile@yahoo.co.in.
| E-mail address: | chaitalimohile@yahoo.co.in |
PRINT THIS ARTICLE

Request Information From Our Sponsors
- StockCharts.com, Inc.
- Candle Patterns
- Candlestick Charting Explained
- Intermarket Technical Analysis
- John Murphy on Chart Analysis
- John Murphy's Chart Pattern Recognition
- John Murphy's Market Message
- MurphyExplainsMarketAnalysis-Intermarket Analysis
- MurphyExplainsMarketAnalysis-Visual Analysis
- StockCharts.com
- Technical Analysis of the Financial Markets
- The Visual Investor
- VectorVest, Inc.
- Executive Premier Workshop
- One-Day Options Course
- OptionsPro
- Retirement Income Workshop
- Sure-Fire Trading Systems (VectorVest, Inc.)
- Trading as a Business Workshop
- VectorVest 7 EOD
- VectorVest 7 RealTime/IntraDay
- VectorVest AutoTester
- VectorVest Educational Services
- VectorVest OnLine
- VectorVest Options Analyzer
- VectorVest ProGraphics v6.0
- VectorVest ProTrader 7
- VectorVest RealTime Derby Tool
- VectorVest Simulator
- VectorVest Variator
- VectorVest Watchdog