

HOT TOPICS LIST
- Strategies
- Stocks
- Buy
- Investing
- Brokers
- Psychology
- Interviews
- Accumulate
- Sell
- Hold
- Spotlight
- Websites
- Candlestick Corner
- Gold & Metals
- Options Trading
LIST OF TOPICS
SECTOR SPOTTING
Ready For Retail?
09/27/07 01:47:41 PM PSTby David Penn
The Fed easing season arrived earlier than expected. And the sector rotation rulebook says it is time to invest in retail stocks. But is retail ready to run?
| Cramer called, and the Fed answered. Say what you want about Jim Cramer, Ben Bernanke, moral hazards or hedge funds in mortgage meltdown ... but there's no doubt that the Federal Reserve got whatever message Wall Street was trying to send in mid-August. Mere days after insisting that the US economy was strong, the Federal Reserve was shoveling credit into the banking system like Sim Webb and Casey Jones shoveling coal and pouring steam into the fateful "Ole 382" locomotive. The Federal Reserve's "This is not a bailout" effort culminated with a 50-basis-point lowering of the discount rate — the rate of interest banks pay in order to borrow from the Federal Reserve. The response from an ever-grateful Wall Street? "Nice start." This intervention from the Fed has done little more than embolden those crying, begging, and demanding further intervention, particularly in the form of a sizable cut in the Fed funds rate at the next meeting of the Federal Reserve in September. By the time this is published, we will likely know whether the Fed has followed through on its "nice start." But one thing is sure: Fed funds rate increases are off the table. This means that the next step in the Fed fund rate is a descending one and, while that may not come as soon as some on Wall Street might like, it remains a safe bet that the Fed easing season will soon be upon us. For the stock trader — especially the sector-sensitive stock trader — the game plan at this point is straightforward: buy those stocks of companies most likely to see disproportionate benefits from loosening monetary policy. Traditionally, this has meant speculating in three main groups: "high-multiple" technology stocks, money center banks and other financial stocks, and retailers. SHOP OR DROP? For those economic agents — corporate and individual — who are behind the eight-ball and unable to take advantage of the credit sale sponsored by the Fed, lower short rates can make it easier for them to repair their balance sheets or, in the case of some, force them out of savings and into investment. Why keep your money in a money market fund with a declining interest rate when you can invest it in common stock and gain capital appreciation from the Fed-induced, liquidity rally? This year, the potential start of the Fed easing season happens to coincide with seasonality tendencies that may further support the idea of speculating on stocks, especially retail stocks. Among the sectors that Yale and Jeffrey Hirsch — authors of the Stock Trader's Almanac — select for outperformance beginning in September, the so-called consumer sector represented by the Morgan Stanley Consumer Index ($CMR) is among the more impressive over the past five- and 10-year periods ended July 2005. This index includes both the retailers that are expected to outperform during a Federal Reserve board easing season — companies such as Wal-Mart — as well as what are often referred to as "consumer staples" companies such as Colgate and Altria Group that are expected to perform well (if unspectacularly), regardless of the economic condition. So it is difficult to see to what degree this index reflects the specific fortunes of retailers, as opposed to companies that serve consumers more generally. But as gauge of consumer purchasing power, the alleged lifeblood of the 21st century, debt-driven economy, it may be more helpful to look at specific retailers — at both the high-end and the medium/low-end — to determine whether the spell-casting, Fed easing season will truly be working its magic this time around. |
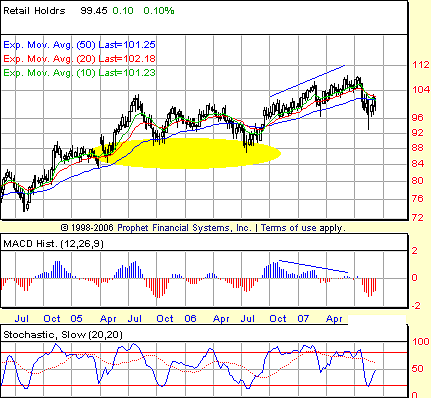
| "LOW LIFE, HIGH LIFE, OH LET'S GO ..." I took a look at the three-year, weekly charts of 10 different retail outlets: five relatively high end (Ann Taylor, Dillards, Nordstroms, Tiffany & Co., and Talbots), and five from the medium to low end (Wal-Mart, Target, Family Dollar, JC Penney, and Men's Wearhouse). I also took a look at various retail niches such as tech (Best Buy), office supplies (Staples), books (Amazon.com and Barnes & Noble), and auto parts (Autozone). Of these 14 stocks, only one, Men's Wearhouse, was in a clear uptrend, traveling above its 50-, 20-, and 10-week exponential moving averages (EMAs). Indeed, if retail stocks are to emerge from their woes (woes that resemble those of stocks in general since mid-August), then a stock like Men's Wearhouse, which managed to weather the storm, is a stock worth watching. First, a glance at retail stocks in general, courtesy of the retail HOLDRS (RTH). Up until their recent sharp correction, retail stocks — as measured by the RTH — had been in a solid bull market for at least a year. The RTH bottomed in the summer of 2006 just south of 90. This 90 level — or, more accurately, the range between 90 and 85 — had been a source of support for previous corrections in RTH in April and October 2005. Thus, it was little surprise that the correction in RTH ended in this zone of proven support. See Figure 1.
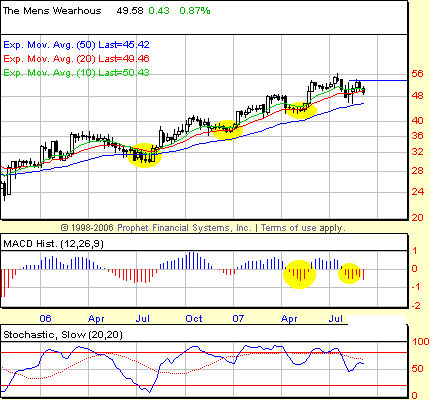
What was interesting about the rally that sprung from the summer of 2006 lows was that unlike previous rallies from this support level, this rally in the RTH managed to set a new all-time high north of the previous all-time high mark set in August 2005 near 104. Shortly after setting this new high, the market for RTH pulled back sharply — though no important support was broken — before vaulting on to even higher highs in the late summer of 2007. It was this push higher — a push accompanied by negative divergences in both the weekly stochastic and the weekly MACD histogram — that led ultimately to the sharp correction that saw RTH fall from roughly 107 to 97 in a matter of days. For better or worse, a good number of retail stocks look just like RTH: topping in the summer of 2007 and falling sharply into August, slicing through previous support and moving averages alike on the way. Both department store Dillards and jeweler Tiffany's very much resemble the chart of RTH. By contrast, other high-end retailers topped out even earlier. Nordstrom's topped out in February 2007, Ann Taylor topped in October 2006, and Talbot's topped out way back in August 2005. With regard to the medium-to-low end retailers, both Target and Family Dollar hit a wall in late July–early August along with many retailers. JC Penney topped earlier, back in February. Wal-Mart for its part has really just oscillated in a trading range between, roughly, 49 and 43 since the spring of 2005. Men's Wearhouse, by stark contrast, looks perfectly fine in the weekly charts, trading above its 50-, 20-, and even 10-week exponential moving averages. |
| RIDING THE RETAILERS If you want to make a bet on the retailers, there are two approaches. One is to make a play for one of the few retailers that is and has been in an uptrend — at least in the weekly charts. In this scenario, you are looking for a buyable dip or a market that is oversold but at support. Breakouts are obviously a great way to get long stocks in this condition, as are BOSO breakouts where the stochastic enters overbought territory and stays there. The other way to play these retailers, should you decide to do so, is through bottom-picking strategies. These strategies include another set of methods, techniques, and setups — most of which can be used together to help confirm a buy-side trade that, because of the technical damage done to stocks in mid-August, may not appear to be an overwhelmingly attractive wager. The tools I am thinking of for bottom-picking markets include bullish reversal Japanese candlestick patterns, positive divergences in the MACD histogram, and reversal patterns such as the 2B. Let's look at an example of a retail stock in both the first and the second instances. Of the major retailers with bullish weekly charts (a list that includes Abercrombie and Fitch, Costco, Gymboree, TJ Maxx, Target, and Men's Wearhouse), perhaps Men's Wearhouse provides the best example of a stock that has weathered the August beating that has felled many a quality stock, including those in the retail cohort. Not only has Men's Wearhouse been in a strong uptrend since autumn 2005, but this uptrend has found consistent support at or near the 50-week exponential moving average as it has moved higher. As the market for MW has moved higher, so has the source of support such that during the second half of 2006 and throughout 2007, Men's Wearhouse found support not at the 50-week EMA, but at the 20-week EMA. This is a sign of strength. See Figure 2.
How can traders climb on board the Men's Wearhouse train? With trending markets, short-term timing devices like MACD histogram patterns (PpP or MmM, for those familiar with my Working-Money.com series on the histogram), as well as hooks in indicators like the TRIX or the stochastic can provide signals which, when accompanied by a confirming close, often offer excellent entries into markets on the move. Consider a PpP bullish pattern in Men's Wearhouse over the first half of May 2007. Specifically, the weeks ended May 4, 11, and 18 set up a perfect PpP pattern in the MACD histogram. The fact that this pattern occurred at a support level (the 20-week exponential moving average) is all the more bullish, assuming the market shows the necessary follow-through in the form of a confirming close. That confirming close arrived on the week ended May 25 with a weekly closing in shares. Just one week later, MW closed three and a half points higher at 53. And after a shallow, month-long pullback, shares of Men's Wearhouse were on the move again, closing as high as 54.71 before a weekly shooting star pattern signaled to longside traders that bullish momentum was waning and that a correction of some sort was increasingly likely. Going forward with Men's Wearhouse, we have another PpP pattern that has developed over the trio of weeks ended August 10, 17, and 24. What is required now is a confirming close over the high of the August 24th session, or 54.13. A weekly close above this level will confirm the PpP pattern and signal that a test of the current highs -- an intraweek print of 56.64 -- is in the making. |
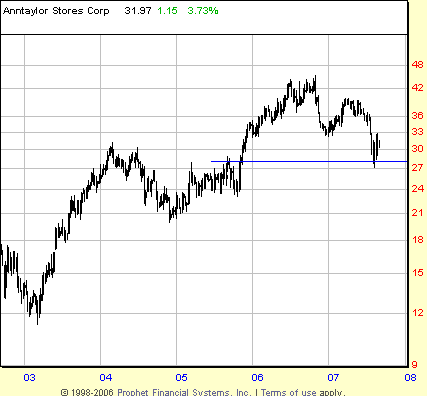
| RETAIL STOCKS ON SALE? What about the other (read: rest) of the retail stock universe? A great number of retail stocks have broken down below the support of their 50-, 20-, or 10-week moving averages — some sharply so (Circuit City being one particularly brutal example). If it is true that retail stocks are about to experience both Fed-induced and seasonal helping hands, then wouldn't it be a terrific bargain to buy one of these "damaged" stocks instead of one of the few, high-flying retailers? First things first. Damaged stocks are damaged for a reason. And while there remains debate about how much a trader needs to know about these reasons before deciding whether to take a position in such a stock, it remains a reasonable approach to wait for stocks to stop going down and to start moving back up before loading up your shopping cart. This again refers to my idea of the importance of a confirming close. While I feel it is important both in buying trending stocks as well as in bottom-feeding, I like to think of position-taking as a two-step process. First, you need a sign that the market is either going in the direction you want or it has stopped going in the direction you don't want (the latter being the case with bottom-feeding for broken stocks). Second, once you get that initial signal, wait for a confirming close in the direction you believe the stock will move before taking a position. Are there times to break the confirming close rule? Sure. For example, when trading based on Japanese candlesticks, I have a tendency to want to sell the open after a shooting star or buy the open after a hammer. But in doing so I am trading strictly the reaction to the reversal pattern, a quick move, and an even swifter profit-taking. Far more often, I wait for the confirming close: a close below the low of a shooting star or a close above the high of a hammer, to follow the example. If you are right in your analysis, then you will not leave too much money on the table by waiting for the market to confirm its direction. And you will avoid many of the situations when you prematurely enter a market that has hinted at a given direction, but not yet shown the capacity to move in that direction. That is what waiting for a confirming close can do for you and your trading. Let's keep this in mind as we look at some of the retail stocks that were particularly hard-hit in August but might, Fed and seasonality willing, find themselves the object of bullish desire in the next few weeks and months. The first thing you want to see on a chart of a stock that is broken are long lower shadows on the breakdown. These shadows, which are evident when candlestick lines are used, indicate waning bearish momentum to the downside. Although there are instances when a market closing at the lows can actually be bullish (the marabozu pattern, for example), generally speaking, long lower shadows are what you want to see when looking at a falling stock you think/hope/anticipate may stop falling. The second thing to look for is near support. Many times you will find yourself looking at a price chart and wonder why a particular market stopped going down at a certain point. Then you expand the view (say, from a six-month chart to a one- or two-year chart) and realize that the market stopped going down because an old support area had been reached. While not impenetrable, support should be taken seriously -- especially if that support is tested by the sort of long lower shadows I just mentioned. The third thing for me is the existence of reversal patterns. This includes both candlestick line patterns such as hammers, morning stars, and piercing patterns, as well as patterns such as the 2B or Turtle Soup popularized by Victor Sperandeo and Larry Connors, respectively. Finally, because they tend to be slower than the forementioned reversal patterns, I look for larger patterns such as head & shoulders bottoms, 1-2-3 trend reversals based on trendlines, descending wedges, and so on. Let's take a look at a retail stock that has broken down. Few of those that made sharp corrections in August have all the features mentioned: the long lower shadows, the technical support, and the reversal pattern. In fact, many of the broken stocks display the first two characteristics; in the wake of the August correction, for example, retail stock charts are replete with long lower shadows in the weekly charts. And a number of these stocks are also finding significant support just as these long lower shadows have appeared. If there were anything characteristically missing, then it would be consistent reversal patterns across the group. There are positive divergences in a number of cases, and those are significant. But the nature of the correction was such that most of the reversal patterns are to be found not in the weekly charts of these stocks, but in the daily ones. A great example of a broken retail stock finding support comes in the chart of Ann Taylor (Figure 3). Ann Taylor actually peaked over the second half of 2006, topping out near 44 before falling to 32 by the beginning of 2007. A bounce in the first quarter took the stock to 40, followed by a sideways second quarter, and by the third quarter of 2007 the downtrend had resumed, taking Ann Taylor down to 28 during the August correction.
This 28 level, however, coincided with the upper boundary of a consolidation zone from the spring and summer of 2005. This kind of historical support is among the first things to look for when a market breaks down and the investing climate is thick with panic. We can tell that the support was effective not just because the market stopped going down, but because of the long, lower shadows that accompany the weekly candlesticks as the upper boundary of that old consolidation zone is tested. Those long lower shadows reflect a successful effort on the part of buyers to bid shares higher in the midst of a strong selling effort by those convinced share prices were headed still lower. While not a reason to buy in and of themselves, long lower shadows such as these help signal the potential of a market to reverse.
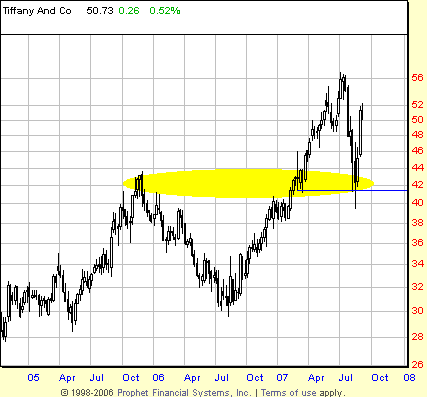
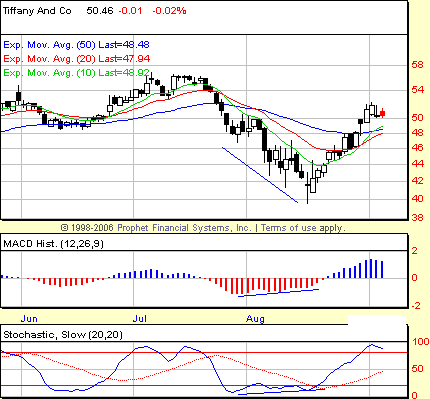
A market that has tested previous support has created the long lower shadows reflecting waning selling strength and has begun to show evidence of a turnaround is Tiffany and Co. (Figures 4 and 5). This stock was also hit hard in August, falling below its 50-, 20-, and 10-week exponential moving averages on a closing basis. The support Tiffany found came both from a short bout of selling in March 2007, as well as from a singular resistance-turned-support from the peak in November 2005 between 44 and 42. We can see the long lower shadows develop in the weekly chart as Tiffany slid into the area between 44 and 42. But no sooner had Tiffany pushed into this support zone did buyers step in and begin bidding shares higher as the stock gained nearly eight points in two weeks (a 19% gain for the then-$42 stock.
I mentioned that most of the reversal patterns — due to the nature of the August correction — were appearing in the daily charts rather than the weekly ones. Tiffany provides an example of this, revealing in the August lows the sort of positive divergences that often accompany market reversals. The daily chart of Tiffany and Co. shows how lows in both the MACD histogram and the stochastic were made at the end of July. Tiffany made a low at the end of July as well. But after a very mild bounce, Tiffany and Co. continued making lower lows going into August. At the same time, both the stochastic and the MACD histogram were making higher lows. This positive divergence continued until midmonth, when shares of Tiffany and Co. put in a doji pattern and began to move steadily higher. Within five days of the doji close, Tiffany had gained five points. |
| COUNTING ON CONSUMPTION I won't deny my own skepticism about retail being able to outperform other sectors this autumn. Like everybody else, I have read about the adjustable rate mortgage resets, the not-so-subprime-anymore contagion crippling hedge funds across the globe, and the likely financial retrenchment both consumers and corporations are expected to embrace as a response to all of this. But as a market technician, it is important to have faith not just in what the technical outlook reveals, but also in the fact that if the outlook turns out to be incorrect, there is no faster way of finding out than by following the technicals. With proper risk control, this means that traders should be able to take advantage of whatever upside the retailers do bring this autumn — whether that upside is ushered in courtesy of a fairly improbable consumer consumption renaissance, the Federal Reserve Board's rate easing benevolence, or even simply a dead-cat bounce in the wake of the August collapse. After all, trading successfully isn't about being right so much as it is about being at the right time. And if the retail stocks show the ability to advance from dips in the few instances where they remain in weekly uptrends, or if they are able to show the sort of confirming close in the wake of true reversal patterns, then working traders have little choice other than to hold their noses, take their positions, manage the risk, and reap whatever reward the market provides. SUGGESTED READING |
Technical Writer for Technical Analysis of STOCKS & COMMODITIES magazine, Working-Money.com, and Traders.com Advantage.
| Title: | Traders.com Technical Writer |
| Company: | Technical Analysis, Inc. |
| Address: | 4757 California Avenue SW |
| Seattle, WA 98116 | |
| Phone # for sales: | 206 938 0570 |
| Fax: | 206 938 1307 |
| Website: | www.traders.com |
| E-mail address: | DPenn@traders.com |
Traders' Resource Links | |
| Charting the Stock Market: The Wyckoff Method -- Books | |
| Working-Money.com -- Online Trading Services | |
| Traders.com Advantage -- Online Trading Services | |
| Technical Analysis of Stocks & Commodities -- Publications and Newsletters | |
| Working Money, at Working-Money.com -- Publications and Newsletters | |
| Traders.com Advantage -- Publications and Newsletters | |
| Professional Traders Starter Kit -- Software | |
PRINT THIS ARTICLE

Request Information From Our Sponsors
- StockCharts.com, Inc.
- Candle Patterns
- Candlestick Charting Explained
- Intermarket Technical Analysis
- John Murphy on Chart Analysis
- John Murphy's Chart Pattern Recognition
- John Murphy's Market Message
- MurphyExplainsMarketAnalysis-Intermarket Analysis
- MurphyExplainsMarketAnalysis-Visual Analysis
- StockCharts.com
- Technical Analysis of the Financial Markets
- The Visual Investor
- VectorVest, Inc.
- Executive Premier Workshop
- One-Day Options Course
- OptionsPro
- Retirement Income Workshop
- Sure-Fire Trading Systems (VectorVest, Inc.)
- Trading as a Business Workshop
- VectorVest 7 EOD
- VectorVest 7 RealTime/IntraDay
- VectorVest AutoTester
- VectorVest Educational Services
- VectorVest OnLine
- VectorVest Options Analyzer
- VectorVest ProGraphics v6.0
- VectorVest ProTrader 7
- VectorVest RealTime Derby Tool
- VectorVest Simulator
- VectorVest Variator
- VectorVest Watchdog