HOT TOPICS LIST
- Strategies
- Stocks
- Buy
- Investing
- Brokers
- Psychology
- Interviews
- Accumulate
- Sell
- Hold
- Spotlight
- Websites
- Candlestick Corner
- Gold & Metals
- Options Trading
LIST OF TOPICS
DOW THEORY
Confirmation Destination
10/12/07 02:35:49 PM PSTby David Penn
Does the tepid bounce in the transports augur badly for the broader market?
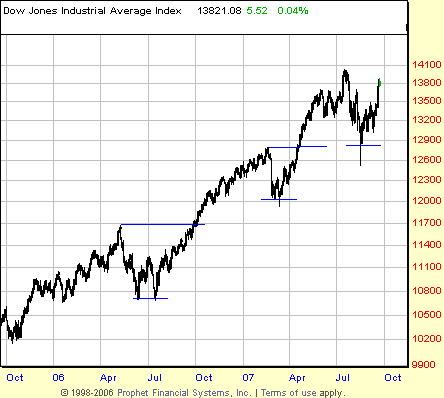
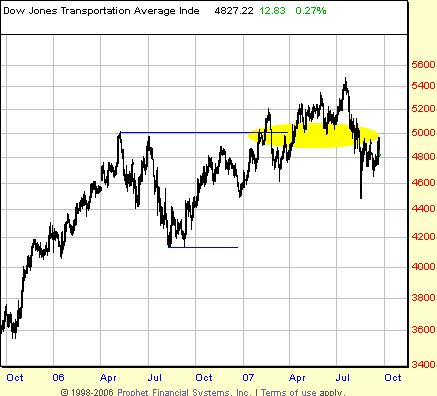
| In a world of increasingly sophisticated trading algorithms, it is worthwhile to remember that many of the tools that traders and investors successfully used decades ago remain valid and valuable to traders today. A properly drawn trendline, an accurately spotted zone of support or resistance, failure to follow through ... all of these very basic concepts of technical trading and analysis are as helpful in the 21st century as they were in the 19th. Not only this, but many of the methods and strategies for analyzing the financial markets that were popularized decades ago, methods such as Elliott wave and Dow theory, have had many of their main tenets assimilated into the technical consensus. How many traders who scoff at Elliott wave analysis nevertheless look to exploit A-B-C corrections as the distance between point B and an undetermined point C begins to match the distance between point A and B? How many traders who consider themselves Dow theory agnostic still find themselves pointing giddily at a chart of the Dow transports when that chart is revealing a bullish reversal not yet mirrored in the Dow industrials (Figure 1)?
There's no need to become an expert in every analytical or interpretive style when it comes to technical trading and analysis. But if you can find the elements in different strategies — the way trends are defined here, the way bull and bear markets are defined there — and incorporate them into your core trading and analytic approach, you can often find techniques that compliment and confirm your own work. For me, when it comes to taking what is most useful from Dow theory, it is without question the theory of confirmation and the relationship between primary trends and secondary corrections and reactions. |
| YES/YES AND NO/NO The idea of confirmation is an important one, whether it is in looking for multiple indicators to confirm an analysis or waiting for a confirming close to support a signal in order to take a position. Confirmation plays an important role in Dow theory as well and is one of the things that non–Dow theorists can keep in mind as they are analyzing the market. In Dow theory, the idea of confirmation between the Dow industrials and Dow transports can be summed up in the phrase: Yes/Yes and No/No. When both averages are doing the same thing — whether that is advancing or declining — they are said to confirm each other. Confirmation, as Robert Edwards and John Magee wrote decades ago in their classic book, Technical Analysis Of Stock Trends, is a positive signal — meaning that it represents information that can be acted on directly. Actionable market intelligence, if you will. This is in contrast to nonconfirmation, which occurs when one average is advancing and the other is declining. Nonconfirmation, it is important to note, does not produce a positive signal. The intelligence provided when the two averages are not mirroring each other or confirming each other is not actionable and does not provide specific trading information. Edwards and Magee warned traders that "no valid signal of a change in trend can be produced by the action of one average alone." Too often, non–Dow theory traders note when one average is rising and the other falling and assume that this divergence between the two averages is bearish — or bullish, for that matter. This is the wrong way to think about nonconfirmations between the industrials and the transports. That is not to say that a nonconfirmation or a divergence between the transports and the industrials is a cause for celebration; it does indeed represent a reason for caution. But too many traders and analysts misread that caution. A nonconfirmation or divergence between the two averages is a cause for concern insofar as (1) the divergence will be resolved sooner or later in the form of a confirmation and (2) the divergence itself does not necessarily reveal whether the confirmation will result in resumption or a change of trend. These are the reasons why traders should be cautious when nonconfirmations between the averages appear, not because nonconfirmations are inherently bearish. PRIMARIES AND SECONDARIES What is a primary market? "Trader Vic" Sperandeo described primary markets this way in his book Trader Vic: Methods Of A Wall Street Master: I like to broaden this notion of secondary corrections and reaction to include sideways movement as well as exclusively the sharp 33% to 66% corrections Sperandeo mentions. The market experience, post-2003, also has me allowing for corrections half as severe as those he notes. What is important for me is less the mathematics of the correction and more the way the market reacts to the correction. Markets are generally considered to have recovered from their secondary corrections and reactions when they rally above the high point of the correction (bullish case) or decline below the low point of the reaction (bearish case). But when do we know whether a correction or reaction is merely that — and consequently an excellent opportunity to place a bet in the direction of the primary trend — or is instead the beginning of a new primary trend in the opposite direction?
|
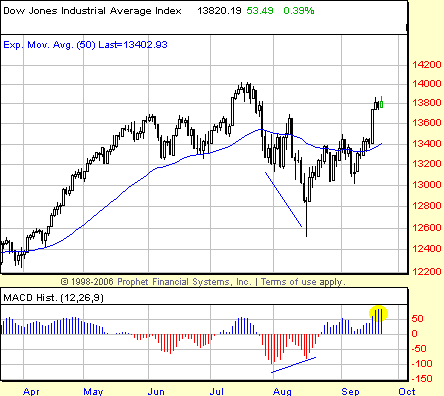
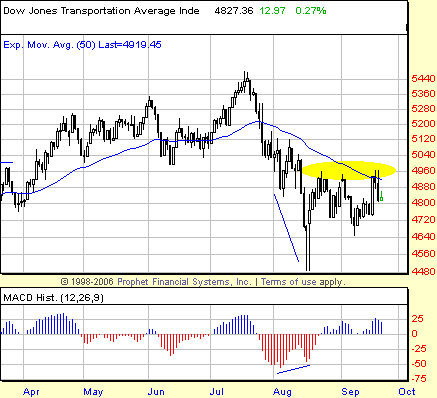
| As long as the market does not close below the low point of the secondary correction (or close above the high of a secondary reaction in the primary bear case), the correction I may be analyzing is considered to be just that: correction or reaction in a primary market. (See Figure 2.) This doesn't necessarily mean riding a losing position all the way down until the market tests that secondary correction low. Basic risk control should prevent that. The point is simply that the trader does not yet know whether the moment marks a great opportunity to participate in the resumption of a trend or a great opportunity to enjoining a market undergoing a significant reversal. This is often where a trader's core set of analytic and trading tools can be especially helpful. Because Dow theory is silent between the moment of nonconfirmation and confirmation, there is an analytic space that can be best assayed by other techniques and methods to determine the likelihood of a top in the positively diverging market or a bottom in the negatively diverging one. A FAILURE TO CONFIRM Both the industrials and transports created bullish positive divergences at the end of their recent July-August corrections. But the similarities may end there. While the relatively milder decline in the industrials was met with a rally that tested the all-time highs near 14,000, the bounce in the transports has been decidedly lackluster. In fact, on a closing basis, the transports have made their first higher high only a few days ago in contrast to the industrials, which accomplished the same feat back in August (Figure 3). What is all the more daunting for the transports is the fact that they remain pinned below their 50-day exponential moving average — again compared to the industrials, which broke out above their 50-day exponential moving average (EMA) back on September 13.
|
| The Dow industrials and transports do not need to mirror each other in order to confirm. As Edwards and Magee remind us, confirmation can come days or even weeks after one average has reached a certain milestone or made a significant move. However, the transports' recent failure to follow through on a closing basis above that 50-day EMA and, instead, fall back from that resistance level augurs poorly for bullish confirmation between the two averages in the near term. The bullish case for both averages is buttressed on the sizable positive divergence in the MACD histogram. Positive divergences like those after significant declines must be respected. And even if they do not result in strongly bullish price action, they often accurately signal the end of significant momentum to the downside. Which type of confirmation is more likely at this point between the averages, a bullish one or a bearish one? In some ways it is a difficult call because from a technical perspective the industrials appear as likely to set new all-time highs as the transports are to set new year-to-date lows. As crazy as it may sound, given the fact that the transports are flirting with year-to-date lows (and crude oil is flirting with record highs), it appears far more likely to me that the transports will confirm the advance of the industrials than the industrials confirming the recent weakness in the transports. (See Figure 4.)
|
| Why so? For all the damage done to the transports, they have yet to take out the low point of the previous significant correction — that being the decline in the summer of 2006 that took the transports down some 17%. The shape of the August 2007 correction in the transports — including that massive hammer candlestick line midmonth — suggests that rather than finding new sellers at the yearly lows, there was a surplus of buyers. This is evidence of significant support at that level, support that could prevent the transports from even testing what would likely be even stronger support in the form of the correction lows from summer 2006. The industrials, it goes without saying, are nowhere near their correction lows from the summer of 2006. And in the same way that the transports outperformed the industrials from late 2005 into summer 2006, it may be the industrials that will now outperform the transports as the markets recover from their most recent correction. SUGGESTED READING |
Technical Writer for Technical Analysis of STOCKS & COMMODITIES magazine, Working-Money.com, and Traders.com Advantage.
| Title: | Traders.com Technical Writer |
| Company: | Technical Analysis, Inc. |
| Address: | 4757 California Avenue SW |
| Seattle, WA 98116 | |
| Phone # for sales: | 206 938 0570 |
| Fax: | 206 938 1307 |
| Website: | www.traders.com |
| E-mail address: | DPenn@traders.com |
Traders' Resource Links | |
| Charting the Stock Market: The Wyckoff Method -- Books | |
| Working-Money.com -- Online Trading Services | |
| Traders.com Advantage -- Online Trading Services | |
| Technical Analysis of Stocks & Commodities -- Publications and Newsletters | |
| Working Money, at Working-Money.com -- Publications and Newsletters | |
| Traders.com Advantage -- Publications and Newsletters | |
| Professional Traders Starter Kit -- Software | |
PRINT THIS ARTICLE

Request Information From Our Sponsors
- StockCharts.com, Inc.
- Candle Patterns
- Candlestick Charting Explained
- Intermarket Technical Analysis
- John Murphy on Chart Analysis
- John Murphy's Chart Pattern Recognition
- John Murphy's Market Message
- MurphyExplainsMarketAnalysis-Intermarket Analysis
- MurphyExplainsMarketAnalysis-Visual Analysis
- StockCharts.com
- Technical Analysis of the Financial Markets
- The Visual Investor
- VectorVest, Inc.
- Executive Premier Workshop
- One-Day Options Course
- OptionsPro
- Retirement Income Workshop
- Sure-Fire Trading Systems (VectorVest, Inc.)
- Trading as a Business Workshop
- VectorVest 7 EOD
- VectorVest 7 RealTime/IntraDay
- VectorVest AutoTester
- VectorVest Educational Services
- VectorVest OnLine
- VectorVest Options Analyzer
- VectorVest ProGraphics v6.0
- VectorVest ProTrader 7
- VectorVest RealTime Derby Tool
- VectorVest Simulator
- VectorVest Variator
- VectorVest Watchdog


