HOT TOPICS LIST
- Strategies
- Stocks
- Buy
- Investing
- Brokers
- Psychology
- Interviews
- Accumulate
- Sell
- Hold
- Spotlight
- Websites
- Candlestick Corner
- Gold & Metals
- Options Trading
LIST OF TOPICS
TRADER'S NOTEBOOK
Elections As The Most Powerful Short-Term Cycle
11/08/07 02:09:59 PM PSTby Matt Blackman
What you don't know about politics could cost you plenty.
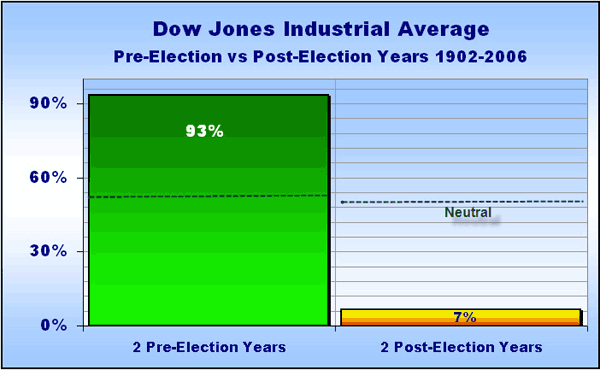
| As traders, we must look at the past and develop probable outcomes for the future. Traders must have more than just a consummate skill in the art of chart reading. They must also understand what part other factors play in the complex price-volume interplay, including seasonal and cyclic patterns. One factor that has garnered significant attention in the trading literature is the election or Presidential cycle. Although much has been written about this phenomenon and opinions differ, one thing is clear. Whether the incumbent US President is a Democrat or a Republican, the period leading up to each election enjoys more economic stimulus than after the voters have picked the winner. So we tested this idea to see if there were any trading gems to be gleaned. PRESIDENTIAL PLAYOFF We based our trading system on a composite chart put together by thechartstore.com of 19 election cycles from 1928 to 2004 that showed a definitive DJIA cycle low at the end of September each midterm year and a high at the end of December of each election year 26 months later. Our backtests compared DJIA returns for the pre-election versus post-election period between 1902 and 2006 in a total of 104 cycles. If there was little or no election effect on the markets, returns for each period should have had roughly equal results. In our case, a neutral result would have been 56:44 (26 months versus 22 months) for a ratio of 1.2:1. It became clear, however, that the two periods were anything but similar (Figure 1).
|
| If the hypothetical trader bought the midterm low and sold the election-year high as per the composite of 19 election cycles, he or she would have outperformed the trader doing the inverse (bought the election-year high and sold the midterm low) by a factor of 13:1! Methodically investing in the DJIA for the 26 months leading up to each election and selling the average election year high would have captured the election trader more than 93% of the DJIA gains from 1902 through 2006, versus a paltry 7% for the inverse strategy. Next, we wondered if governments had gotten better at prepping markets for each election or if, as some have suggested, the Presidential cycle had lost its clout. How would our hypothetical trader have done trading this system in the last three election cycles? To make our tests more realistic, we employed a system to buy the basket of Dow 30 stocks at the beginning of each period and sell all stocks at the end of the period and include the cost of commissions. For our tests we used the VectorVest Simulator, which allowed us to utilize a complex set of inputs to give us realistic outcomes. Here's what we found.
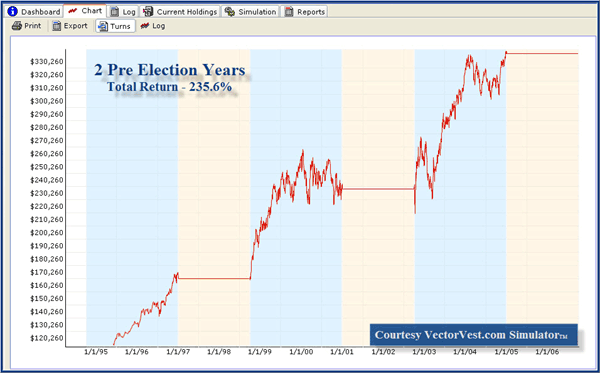
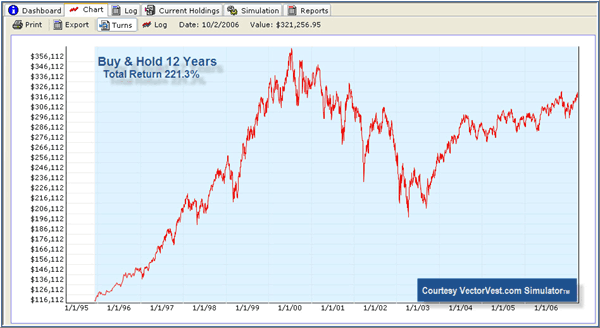
BEST TWO YEARS OF THE ELECTION CYCLE Over the subsequent 26 pre-election months (October 2, 1998, through the end of December 2000), both were in the market. The buy & hold portfolio peaked at $357,903 on January 7, 2000 (Figure 3), and declined to $308,218 by the end of December. Meanwhile, the election system grew to $233,783 before the trader exited December 29, 2000, for the next post-election period.
|
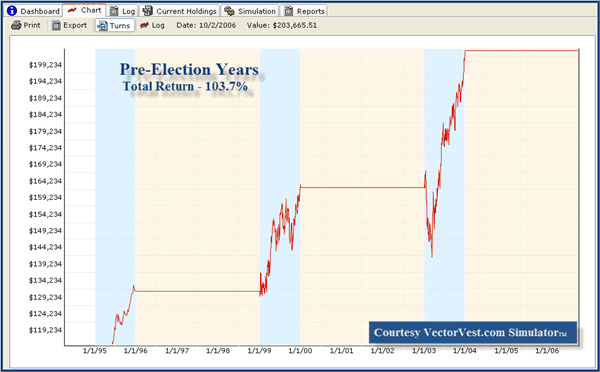
| Over the next 22 month post-election period, the buy & hold investors saw the value of his portfolio plunge to $210,057 by September 30, 2002, while the election trader sat on the sidelines. Our election trader again entered the market at the midterm low on October 1, 2002, and both portfolios grew so that by December 30, 2004, the election trader's portfolio had grown to $336,855, while the buy & hold investor's portfolio increased to $301,450. At this point, the election trader exited while the buy & holder stayed in the market. By the end of the test period on October 2, 2006, the buy & holder had narrowed the gap with a final portfolio value of $321,257. As well as the fact that the election trader's portfolio was bigger at the end of the testing period, there were three major differences between the two approaches: 1 Risk exposure. While the buy & hold investor had his money in the market and exposed to risk for all 4,383 trading days in 13 years, the election trader was at risk for 2,463 days or 56% of the time. So in a little more than half the time and including the cost of commissions the election trader made more money. We then tested the inverse election trading system in which the trader bought post-election and sold at the midterm low 22 months later. This system earned a grand total of $1,171 for a return over the period of 1.2% after commissions. BEST YEAR OF THE ELECTION CYCLE As we see from our results, buying the Dow 30 stocks for the calendar 12 months in pre-election years returned 104% in three cycles (see Figure 4). This was significantly better (42.1% more) than the trader would have earned by buying & holding in each of the other three years (total 61.6%) in the election cycle combined!
|
| PERDITION AVOIDANCE In the final analysis, the reasons that markets do better leading up to elections need not consume the trader. Simply to know that such a wide discrepancy exists presents trading opportunities. The road to trading hell is littered with the broken dreams of those who made big profits but then lost them thanks to unwieldy drawdowns. Most of us have learned that a 50% loss requires a 100% win just to get even again. Keeping losses contained makes it easier to get back into the black when the rally resumes. Traders who win consistently don't necessarily earn the biggest profits; they are able to hold on to a larger percentage of what they earn because they minimize losses. Survival in this labyrinthine jungle is all about risk management. Staying out of the market during the two years post-election won't guarantee you won't lose money, but this work shows that average losses should be smaller. Trading the pre-election period does not involve a large number of trades and it is a simple system to employ. Perhaps best of all, your maximum drawdowns should also be more manageable, leaving you with a lot more cash to play the pre-election party and greatly increase your chances of garnering you your fair share of the political bounty that begins to surge through Wall Street every four years. |
| SUGGESTED READING Election Cycle Primer http://tradesystemguru.com/content/view/82/58/#Primer The VectorVest Simulator background information http://www.vectorvest.com/products/simulator.htm |
Matt Blackman is a full-time technical and financial writer and trader. He produces corporate and financial newsletters, and assists clients in getting published in the mainstream media. He tweets about stocks he is watching at www.twitter.com/RatioTrade Matt has earned the Chartered Market Technician (CMT) designation.
| E-mail address: | indextradermb@gmail.com |
PRINT THIS ARTICLE

Request Information From Our Sponsors
- StockCharts.com, Inc.
- Candle Patterns
- Candlestick Charting Explained
- Intermarket Technical Analysis
- John Murphy on Chart Analysis
- John Murphy's Chart Pattern Recognition
- John Murphy's Market Message
- MurphyExplainsMarketAnalysis-Intermarket Analysis
- MurphyExplainsMarketAnalysis-Visual Analysis
- StockCharts.com
- Technical Analysis of the Financial Markets
- The Visual Investor
- VectorVest, Inc.
- Executive Premier Workshop
- One-Day Options Course
- OptionsPro
- Retirement Income Workshop
- Sure-Fire Trading Systems (VectorVest, Inc.)
- Trading as a Business Workshop
- VectorVest 7 EOD
- VectorVest 7 RealTime/IntraDay
- VectorVest AutoTester
- VectorVest Educational Services
- VectorVest OnLine
- VectorVest Options Analyzer
- VectorVest ProGraphics v6.0
- VectorVest ProTrader 7
- VectorVest RealTime Derby Tool
- VectorVest Simulator
- VectorVest Variator
- VectorVest Watchdog


