HOT TOPICS LIST
- Strategies
- Stocks
- Buy
- Investing
- Brokers
- Psychology
- Interviews
- Accumulate
- Sell
- Hold
- Spotlight
- Websites
- Candlestick Corner
- Gold & Metals
- Options Trading
LIST OF TOPICS
TRADER'S NOTEBOOK
Trading The 10-Bagger
12/04/07 02:28:53 PM PSTby Thomas Maskell
In this, the latest installment of the 10-bagger series, we look at the phenomenon from the viewpoint of the trader.
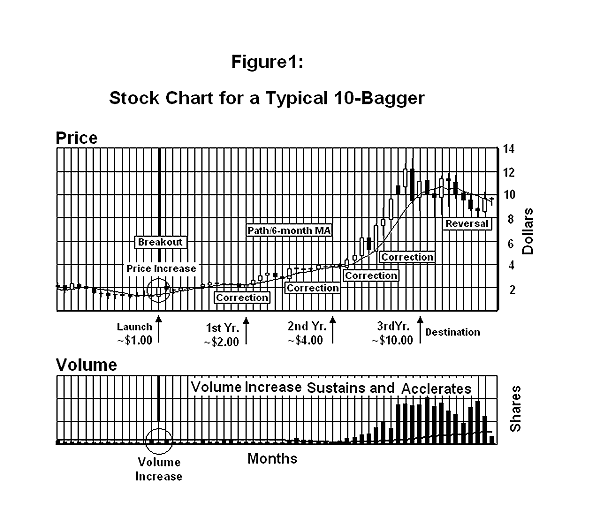
| In my previous installment of the 10-bagger series, we discovered that fundamental analysis was not a good predictor of 10-bag performance. However, as one reader pointed out, there were significant fundamental separations between 10-baggers and the overall stock market. Yet, from an investor's point of view, those separations did not predict 10-bag status. For instance, the observation that 75% of 10-baggers are losing money prior to their launch is hardly a reason to buy a stock. Fundamentalists are not in the habit of buying losing companies. So today, we are going to explore 10-baggers from a different perspective — the trader's viewpoint. KEEP IT SIMPLE Of course, most technical analysts readily admit this. After all, they are not concerned with why a stock does what it does; they are only concerned with what it is doing. Since the prediction of 10-baggers is based on "the why" and not "the what," we might be tempted to discard technical analysis as an analytical tool. But we won't. There are two reasons why. First, while the causal foundations of trading may be suspect, the fact is that 90% of stock market profits come from trading stocks. Thus, trading cannot be ignored. Second, trading provides an immediacy of observation. As I have observed in earlier articles, 10-baggers often move six to 12 months prior to a change in company performance. As investors, we are conditioned to wait for the change. As traders, we are conditioned to react to the move. When it comes to 10-baggers, time is money, and immediacy has its rewards. So we will not ignore trading, but we will also not elevate it beyond its worth. In that regard, we will keep it simple. There will be no use of moving average convergence/divergence (MACD) or on-balance volume (OBV) or relative strength index (RSI). These are all just manipulations of the basic inputs of price and volume. They may clarify, but they do not enlighten. We will skip the manipulations and focus on the basic inputs — price and volume. I'll leave the technical analysis to the mathematically adept and the true believers. We'll start our analysis by dividing the chart into four sections: the launch (or breakout), the path (or trend), the potholes (or corrections), and the destination (or reversal). These are all illustrated in Figure 1. The objective is to determine how the 10-baggers differ from the overall market with respect to price and volume. Unlike our fundamental comparison, we are not looking for cause and effect; we are looking for degrees of separation that identify that a 10-bagger has been set in motion as it is occurring.
|
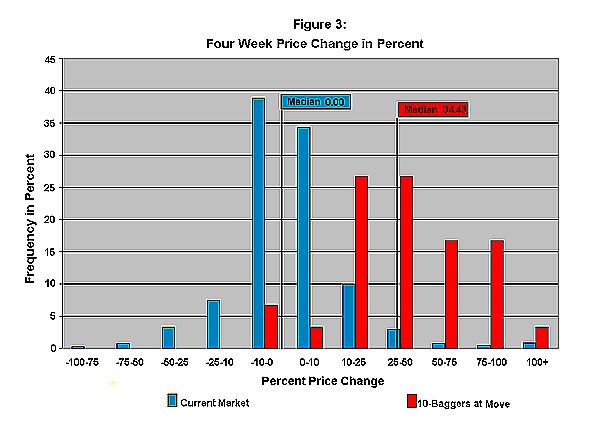
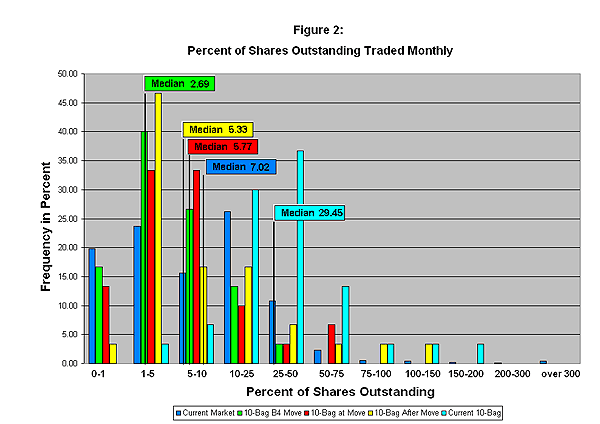
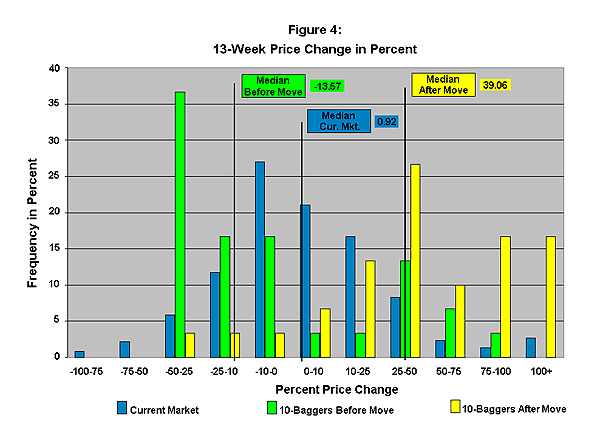
| THE LAUNCH (BREAKOUT) The launch has been defined as the point at which the price of a stock rises above its six-month moving average (MA). However, many 10-baggers will exhibit false starts. These false starts occur when the stock rises above its six-month MA but then falls back. They can stay in this fallback position for months, even years. This results in a losing trade or if you hang on to the stock, lost time and money. And worse, a false breakout may mean that the stock in question isn't a 10-bagger; it may simply be some pump-and-dump scheme that you have bought on the dump side. How can we distinguish between a real launch and a false start? There are several clues (but no guarantees). The first clue is the sheer size of the price move. As illustrated in Figure 2, the median monthly price move for the overall market is 0.00%. The median launch price increase for a 10-bagger is 34.43%; thus, 10-baggers are in the top 3% of the overall market. Viewed another way, if a stock's price increases 34% or more in a month, there is a one in 10 chance that you are looking at a 10-bagger. Another clue is volume. The median volume increase for 10-baggers at launch is 114%, which is in the top 4.5% of the overall market. Figure 3 shows the volume profile of a 10-bagger, and the increase stated is calculated by dividing the volume before the move into the volume at the move (5.77 / 2.69). When we combine both the price and the volume increases, we discover that only 1% of the overall market exhibits that level of positive activity. Your odds have just improved from one in 10 to one in three that a price move on volume is a 10-bagger. The final clue comes after the launch. It is more of a confirmation than an immediate indicator. It is the 13-week price movement that occurs after the launch, which is illustrated in Figure 4. The median 13-week price increase of a 10-bagger is 39.06%, compared to the market increase of just 0.92%. It is clear four months into the move that these stocks are establishing a new price trend. If you couple this price observation with the observation that the volume of shares traded is maintaining the launch level (Figure 3, 5.77 at launch and 5.31 after launch), there is a strong sense that a 10-bagger may be in the making.
THE PATH (TREND) While this price rise is occurring, the volume of shares traded also increases. The volume increase is even more dramatic than the price increase. In some cases, 100% of the shares outstanding are traded in one month. The implications are intriguing, but that will have to be addressed for another time. What is clear from the chart (and illustrated in Figure 3) is that the percentage of the shares outstanding that are traded grows to far exceed the normal volume traded in the overall market. At its destination, the median level for the number of shares traded, as a percentage of the shares outstanding, is 29.45% compared to just 7.02% for the overall market. There is plenty of price and volume confirmation along the path of a 10-bagger chart. |
 FIGURE 3: VOLUME PROFILE OF A 10-BAGGER. The median volume increase for 10-baggers at launch is 114%, which is in the top 4.5% of the overall market. THE POTHOLES (CORRECTIONS) For the trader, the goal is to distinguish between a correction and a reversal. In that regard, the six-month MA is of little value since 76.7% of the 10-baggers would trigger multiple sell signals prior to the stock's peak price. Unfortunately, adding the size of the price correction and the volume of the shares traded during the correction did not aid in the distinction. However (and here I am about to break my promise to keep it simple), the MACD did offer some insights. Only five of the 193 corrections (2.6%) triggered an MACD sell signal (monthly MACD). Thus, you have a 97% confidence level that a price decline that does not trigger the MACD is a correction rather than a reversal. This is a significant improvement over the 71.2% confidence level offered by a simple decline below the six-month MA.
THE DESTINATION (REVERSAL) All reversals trigger a MACD sell signal, but not all MACD sells signs indicate a reversal. Previously, we have identified five MACD sell signs that were later determined to be simple corrections. So there is a risk that if we sell on the MACD, we will sell too early. What is that risk? It is 14.3%. This means you are more than 85% confident that you are making a correct sell decision. This is considerably higher than the reported success rate of top business executives. Their success rate is just 70%. Thus, when it comes to 10-baggers, selling on the monthly MACD appears to be good business. |
 FIGURE 5: HOW EFFICIENT IS THE 10-BAGGER? Trading a 10-bagger is not very efficient, but it is still very profitable. When the 23.6% efficiency number is applied to a typical 10-bagger, the annual rate of return on a 30-month trade is more than 50%. CONCLUSION It is clear from Figure 5 that trading a 10-bagger is not efficient, but it is still very profitable. When the 23.6% efficiency number is applied to a typical 10-bagger, the annual rate of return on a 30-month trade is more than 50%. In other words, a $5,000 play will grow to $329,159 in 10 years. Compared to the average stock market return over the same period of just $14,197, trading 10-baggers is a lucrative business. Yet, 23.6% leaves a lot of room for improvement. Could we do better? My trading experience indicates that any attempt to speed up the process to increase efficiency tends to have a negative impact on effectiveness. In essence, when we are right, we make more (efficiency), but we are right less often (effectiveness). A series of ineffective trades will ultimately reduce the overall efficiency of the strategy. So where is the answer? Our analysis of the fundamentals demonstrated that the answer isn't there. They would be even slower to buy and slower to sell, which would reduce the efficiency further. And there is no evidence that they would be any more effective. That leaves us with just one player to turn to — the speculator. They may have the answer, but they will have to wait until the next installment. |
| SUGGESTED READING Maskell, Thomas [2006]. "The Search For The 10-Bagger Begins," Working-Money.com, March 23. _____ [2006]. "The Anatomy Of The 10-Bagger," Working-Money.com, September 5. _____ [2007]. "Search For The 10-Bagger Fundamentals," Working-Money.com, July 3. |
Thomas Maskell is a frequent S&C contributor whose recent book, The Complete Guide to Investing During Retirement, provides an excellent primer on investing, trading and speculation in the stock market. It is available nationwide. To comment on this article or his book, contact him at Retireestocks@aol.com or visit his blog at retireestocks.blogspot.com.
| E-mail address: | Retireestocks@aol.com |
PRINT THIS ARTICLE

Request Information From Our Sponsors
- StockCharts.com, Inc.
- Candle Patterns
- Candlestick Charting Explained
- Intermarket Technical Analysis
- John Murphy on Chart Analysis
- John Murphy's Chart Pattern Recognition
- John Murphy's Market Message
- MurphyExplainsMarketAnalysis-Intermarket Analysis
- MurphyExplainsMarketAnalysis-Visual Analysis
- StockCharts.com
- Technical Analysis of the Financial Markets
- The Visual Investor
- VectorVest, Inc.
- Executive Premier Workshop
- One-Day Options Course
- OptionsPro
- Retirement Income Workshop
- Sure-Fire Trading Systems (VectorVest, Inc.)
- Trading as a Business Workshop
- VectorVest 7 EOD
- VectorVest 7 RealTime/IntraDay
- VectorVest AutoTester
- VectorVest Educational Services
- VectorVest OnLine
- VectorVest Options Analyzer
- VectorVest ProGraphics v6.0
- VectorVest ProTrader 7
- VectorVest RealTime Derby Tool
- VectorVest Simulator
- VectorVest Variator
- VectorVest Watchdog


