

HOT TOPICS LIST
- Strategies
- Stocks
- Buy
- Investing
- Brokers
- Psychology
- Interviews
- Accumulate
- Sell
- Hold
- Spotlight
- Websites
- Candlestick Corner
- Gold & Metals
- Options Trading
LIST OF TOPICS
CANDLESTICK CORNER
1-2-3 Reversal Signal
12/26/07 02:35:01 PM PSTby Chaitali Mohile
Identifying trend reversal points is difficult in trending markets and it is even more difficult to choose appropriate entry & exit levels. Here are a few complex patterns made simple.
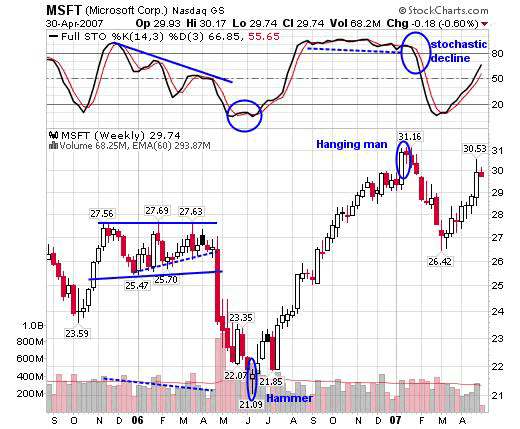
| Markets reverse when they top or bottom out after moving in one direction for a considerable length of time. Often the reversal points offer good trading opportunities, so recognizing these signals will certainly benefit your trading results. How can you understand these situations and cultivate trading habits accordingly? In this article, I have emphasized price charts with no moving average overlays, no complicated oscillators, and no trend identifying indicators. I have followed just the full stochastic merely for confirmation on trades at critical turning points of the market. So what exactly is 1-2-3? In its simplest form, the (1) refers to the single reversal candlestick pattern on that chart that gives a strong reversal signal and which often goes unnoticed. The (2) refers to a double top or bottom, and the (3) refers to a triple top or bottom. TRIPLE FORMATIONS (TOPS/BOTTOMS) In triple-top formations, there are three tops approximately at equal highs. The Japanese name for the triple top is san-zan, meaning three mountains. The three tops are of approximately equal heights. This formation makes major tops in the market. The neckline forms the support level so a breakdown at this level indicates the end of the formation. The weekly chart of Microsoft Corp. in Figure 1 displays a triple-top formation. The triple top is formed between November 2005 and April 2006. The longer it takes for the pattern to form, the greater the significance of the price move after a breakout from the pattern occurs. Triple tops should be assessed carefully since there are variations in the pattern. For example, till the third peak is formed the pattern may look like a double top, so the price action at the neckline should be watched carefully. In Figure 1 you can see that the volume is higher on the first peak, and it reduces further till the third peak is formed. Now let's see how the pattern can be traded. In Figure 1, as the price moved to form its first peak at $27.56, the stochastic (14,3,3) was highly overbought, giving the preliminary warning of a decline. This is the first stage for profit booking, and you can see from the chart that the price declined to $25.47. From here prices moved up to form the second peak at a high close to the first one. If you look at the stochastic oscillator, however, you'll see that it formed a lower high. This negative divergence signifies that a downfall could be ahead. The formation of the second trough is important. Since two peaks have already formed, if prices break down below the support level or neckline, the pattern could become a double top. In this case, the stock price made a higher low at $25.70 and rallied back to the previous high and made a third top. The higher lows that formed during the entire formation could be indicative of a variation in pattern -- that is, the ascending triangle. Shortly after the formation of the third top, prices broke below the neckline accompanied by enthusiastic volume. The price target was achieved within a week without turning back to the support line. The minimum expected price level is calculated by subtracting the highest peak of the pattern from the lowest low of the pattern. In this instance, the height of pattern is $27.69 (highest peak) - $25.47 (lowest low) = $2.22. If you subtract $2.22 from $25.47, you get $23.25, which is the price target of this pattern formation. Prices drifted even lower to $21.09. The stochastic has consolidated at oversold levels, preparing for a bullish move. The same chart clarifies the single reversal candlestick pattern, referred to as the hammer and the hanging man. |
| THE HAMMER The hammer is a bottom reversal signal, so it will appear at the end of a falling trend. The hammer's long lower shadow and close at or near the high of the session relays that the market sold off sharply during the session and then bounced back close to or near the session's high. Closing at or near the high is a reason for not having an upper shadow. If an upper shadow exists, then it would mean the market closed well off its high. Though the pattern is strong, a reversal confirmation can save you from being trapped. In Figure 1, the lowest level of $21.09 is made by the hammer candlestick. The pattern on the chart has a small upper shadow. For a lower risk-buying opportunity, the second bullish candle that opened higher while the stochastic was in oversold territory would be a good entry point. The volume-loaded bullish rally surged to a new high at $31.16 with the stochastic moving flat at overbought levels.
|
| HANGING MAN The end of this bull run was marked by a hanging man appearing at a high of $31.16. For the hanging man to appear, price action must trade much lower than its open, then rally to close near the high. This forms a long, lower shadow that suggests that the market just might begin a selloff. The reversal pattern is confirmed if the next session closes under the hanging man. It is always better to wait for a confirmation rather than entering the trade on the day the hanging man emerges. Candlestick analyst Steve Nison suggests this trading technique with the rationale that if the market closes lower in the next session, then those who bought on the open or close of the hanging man day are now left hanging with a losing position. In the chart, the hanging man has emerged after a long advanced rally. Along with its appearance, you need more confirmation from the indicator. The stochastic (14,3,3) has been relatively flat in overbought territory for a period of five months. The indicator declined at the next weak opening, so at this point it is best to wind up your long positions. The chart reflects similar kinds of trades: long positions are already exhausted at the top, while the short trade is in command with the next session's lower closing. Hammers and hanging men appear frequently and are highly noticeable. Many fail to trade it without waiting for confirmation. Even though the pattern indicates a reversal, a supporting momentum indicator may help to save the loss. |
| TRIPLE BOTTOMS Triple bottoms are bullish reversal patterns and, being a bottom formation, take even longer to develop than the triple tops. The Japanese name for a triple bottom is san-zen, meaning three rivers. The lows of the three bottoms should be at approximately the same level. Often, the three lows are just one-day spikes. A breakout from the formation starts a new upside rally. The variation pattern of a triple bottom is a head & shoulders bottom, but in this case, the middle head has a lower low than the other two bottoms. Until the triple bottom is formed, the formation resembles a double bottom and descending triangle or rectangle. Volume flow is important if you want to trade a triple bottom. The volume gets exhausted until the third bottom is formed but must expand when prices break out above the neckline. When prices break out of the neckline with increased volume, it provides an excellent trading opportunity. As with triple tops, it is best to use an oscillator to identify the oversold or overbought areas. The triple-bottom pattern is pretty reliable. The estimated failure rate is as low as 4%, assuming that traders wait for the upside breakout through the confirmation point. The target level calculation is similar to the H&S bottom. The distance between the resistance line or neckline and low is measured and then added to the price level where the breakout took place. |
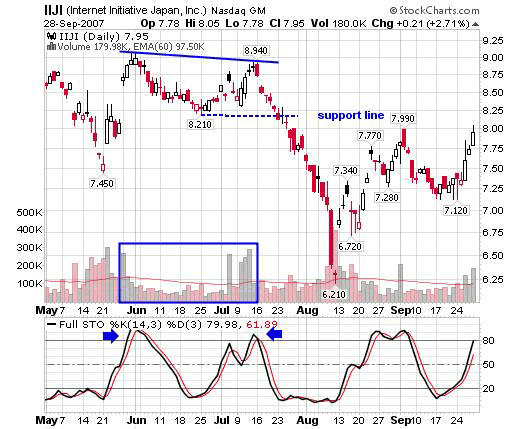
| DOUBLE FORMATION (TOPS/BOTTOMS) This pattern is easily identified, a short-term formation frequently appearing after an advancing or declining rally. A double top is a reversal pattern that turns the present uptrend to a downtrend. The prior rally can be a huge upside move or a small bull run. The distance between two peaks should be at least four weeks for a valid reversal top to form. The volume remains high at the first top and later, as the pattern matures, it may turn irregular. As the second top is formed the price slips back to the support line, this time breaking further down. Although the double top is common and easily understood, it is unclear whether it can be traded tactfully.
On the chart of Internet Initiative Japan, Inc. (IIJI), in Figure 2 I will show you how you can successfully trade the double-top formation. The price of IIJI hit a high at $9.14 after surging from a low of $7.450. It then descended forming a valley and support at $8.210. From there it again flew back to form a second peak at $8.940. During this formation, take a look at the movement in the stochastic oscillator. The indicator mirrored the price movement by making a double top with a deep oversold valley in between. The first peak of the double top should have strong volume, which cools off as price lowers. As the second peak is forming, volume gradually rises again. This means that at the first peak in price and stochastic there is some profit-taking. When prices decline to the valley, the stochastic is oversold. More buyers come in during the second rally. The declining rally from second peak to the support line completes the formation. It is only after this support line is violated, followed by the continuing declining rally, that the double-top formation is confirmed. At the support line breakout, you can open up short positions. The price target of this downside rally can be calculated by measuring the height of formation and subtracting it from the support line. In this case, it would be $9.14 - $8.21 = $0.93 - $8.21 = $7.28. The reaction move rallied further down below the target level, marking a low of $6.21. This is quite typical in a breakout move below the support level of a double top. But how do you know there is a possibility of prices heading beyond the target level? At such crucial points the stochastic oscillator can help you decide when to exit the trade.
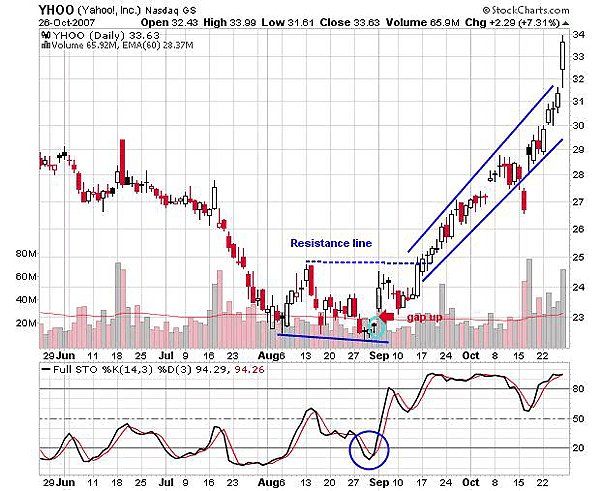
On the daily chart of Yahoo, Inc. (YHOO), in Figure 3 you see a bullish reversal short-term pattern or a double-bottom pattern. This pattern is formed after an adverse bearish rally from $29 to a low around $21. The second bottom is also approximately at the same level. In both these lows you see the formation of a hammer and both are followed by an upside surge. The time period between the two bottoms is just four weeks, which qualifies it as a double bottom. There are two reasons I selected this chart as an example; one is the appearance of two hammer candlestick and the other is the formation of a trough between the two bottoms, which gives it the appearance of a triple bottom. But because triple bottoms don't occur in such a short time span, this is a double-bottom formation. Going back to the hammer candlestick pattern on the first low, note the long lower shadow and small upper shadow. This might misguide traders into thinking the market will reverse and lure them into opening a long trade. But if you look at the stochastic (14,3,3), you'll see that it hardly reached the 60 levels on the retracement. This should make buyers aware of an impending bearish pressure. The hammer that formed on the second low was followed by a gap up. This hammer and the completion of the double bottom are two bullish signals, and both together have added an inflow of volume, which strengthens the future bullish breakout. For further confirmation the stochastic (14,3,3) is highly oversold and ready for a bullish move. The breakout from the double bottom above the resistance line rallied faster and is still continuing its bull run. As of this writing the bulls are still charging with increased strength with no sign of exhaustion. |
Chaitali Mohile is an active trader in the Indian stock markets. She may be reached at chaitalimohile@yahoo.co.in.
| E-mail address: | chaitalimohile@yahoo.co.in |
PRINT THIS ARTICLE

Request Information From Our Sponsors
- StockCharts.com, Inc.
- Candle Patterns
- Candlestick Charting Explained
- Intermarket Technical Analysis
- John Murphy on Chart Analysis
- John Murphy's Chart Pattern Recognition
- John Murphy's Market Message
- MurphyExplainsMarketAnalysis-Intermarket Analysis
- MurphyExplainsMarketAnalysis-Visual Analysis
- StockCharts.com
- Technical Analysis of the Financial Markets
- The Visual Investor
- VectorVest, Inc.
- Executive Premier Workshop
- One-Day Options Course
- OptionsPro
- Retirement Income Workshop
- Sure-Fire Trading Systems (VectorVest, Inc.)
- Trading as a Business Workshop
- VectorVest 7 EOD
- VectorVest 7 RealTime/IntraDay
- VectorVest AutoTester
- VectorVest Educational Services
- VectorVest OnLine
- VectorVest Options Analyzer
- VectorVest ProGraphics v6.0
- VectorVest ProTrader 7
- VectorVest RealTime Derby Tool
- VectorVest Simulator
- VectorVest Variator
- VectorVest Watchdog