HOT TOPICS LIST
- Strategies
- Stocks
- Buy
- Investing
- Brokers
- Psychology
- Interviews
- Accumulate
- Sell
- Hold
- Spotlight
- Websites
- Candlestick Corner
- Gold & Metals
- Options Trading
LIST OF TOPICS
TRADER'S NOTEBOOK
In Search Of The Next Big Game
01/16/08 02:35:08 PM PSTby Matt Blackman
Stocks go up when there are more buyers than sellers, down when the opposite occurs and short-sellers are a big part of the picture. But when a heavily shorted stock rallies, it can provide those in the know with a powerful trading strategy that works well in both good markets and bad. Here's how it works.
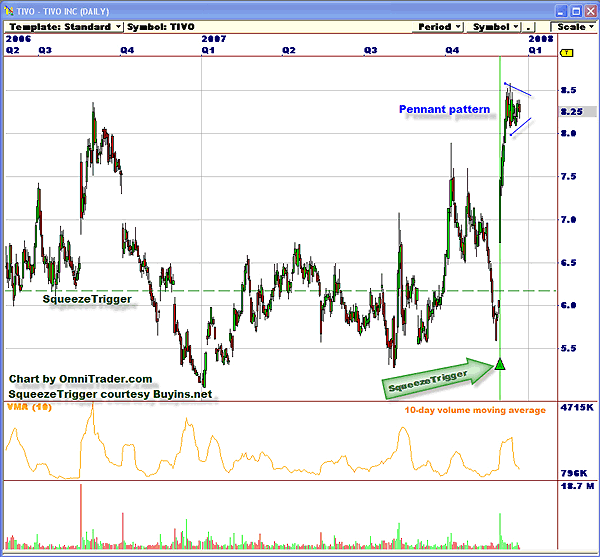
| After the market closed on November 28, 2007, digital video recorder manufacturer TiVo Inc. (TIVO) announced a loss for the fiscal third quarter that was less than expected on a 14% rise in revenues. The stock had closed the normal trading day at $5.98. But in after-hours and premarket trading, the stock gapped up, opening the next regular trading day at $6.73 and zooming up to close at $7.46. Over the next week it continued to rally to as high as $8.50. The news was good, but it certainly wasn't that good. What caused this explosive breakout? Hint: The stock had been heavily shorted. But how do shorts, betting that the price will drop, help catapult a stock into the stratosphere? DOUBLE-EDGED SHORT SWORD Here is an important point about shorting that exerts a strong influence on participants: There is no limit to how far up a stock can go in a rally. Just look at a stock like Google (GOOG) that saw its stock price rise from its initial public offering in August 2004 of $108 to more than $740 in November 2007, which is more than a 700% gain. Risk is limited to the amount invested. However, this situation is reversed for the short-seller -- the gain for a short is limited to 100%, and that is if the stock goes to zero. But the real kicker is that a short position has unlimited potential for loss. For example, a short position in Google entered in 2004 would have been down 700% by November 2007 if it had been unleveraged (no margin). A position margined 50% would have been down 1,400%. An initial position that cost $10,000 would have generated a loss of $140,000. And the loss continues to compound in a rally. This characteristic is a powerful motivator for shorts to cover when they are proven wrong and one big reason why most will charge for the exits if a loss looks imminent. A NAKED SHORT? A true naked short is somewhat more menacing, however. According to the Securities and Exchange Commission (SEC), a naked short sale occurs when "the seller does not borrow or arrange to borrow the securities in time to make delivery to the buyer within the standard three-day settlement period." As a result, the seller fails to deliver securities to the buyer when delivery is due; this is known as a failure to deliver. While this saves the usual transaction cost, the real benefit to practitioners has far more ominous implications for the rest of us. Bloomberg Television aired a 25-minute documentary in March called Phantom Shares that is a "must-see" for anyone who trades (or invests). The show opened a fascinating window on the practice of naked shorting that has permeated Wall Street for years. Approximately $350 billion in shares traded daily and were settled normally on US stock exchanges in 2006, according to the Depository Trust & Clearing Corp. (DTCC). Of that, $6 billion worth had shares that failed to be delivered, according to the documentary. Some of this shortfall was due to a clerical error or the loss of share certificates, but naked shorting is a notable culprit. While naked shorting isn't illegal (unless fraud can be proven) and in fact occurs daily and is necessary to facilitate the orderly flow of shares by market makers, the problem for shareholders is that because no share certificates change hands, the naked short-seller could sell millions of shares that don't exist. In the worst-case scenario, the practice can overwhelm buy orders and drive share price into the basement, much like the impact on a currency that is heavily counterfeited. How will you know if shares of the company you own are being manipulated this way? There is no specific naked short data to warn investors that their shares are at risk (with one possible exception that we discuss). The SEC officially forbids naked short sales but puts the restrictions on brokers, not short-sellers. The SEC enacted a new regulation called Regulation Short Sales (RegSHO) in 2005 that was supposed to address the problem by requiring that companies with shares that failed to deliver (FTD) be put on a threshold list. Once on this list, shares for companies must be delivered within 13 trading days and restrictions are placed on further short sales in that company. That the practice continues indicates that there is a loophole. Until a recent rule change, shares naked shorted in a company before it was put on the threshold list could remain unsettled almost indefinitely. While that loophole has been closed, another remains, and according to Tom Ronk, CEO and founder of Buyins.net, that is the lack of enforcement. One only has to look at the unwitting poster child for naked shorting that until recently topped the RegSHO threshold list. Before Overstock.com (OSTK) was removed December 17, it had been on the list for nearly two years (669 days) according to Buyins.net, a service that tracks short data. On December 18, 2007, a total of 32 companies appeared on the list with shares listed as FTD for 100 days or more. At the top of that list was Medis Technologies (MDTL) with FTD shares for 597 days, according to Buyins.net. This situation clearly shows that the practice is still alive and well. Think this is only a problem that affects cheap stocks? Think again. A total of 168 companies had shares appear as FTD on the RegSHO threshold list on December 19 with an average selling price of $19.30. They include companies Chipotle Mexican Grill (CMG) at $140.45, iShares S&P National Municipal ETF (MUB) at $101.92, and iShares Tr Biotech ETF (IBB) at $81.28. The good news is that the furor surrounding short sales, and resultant Reg SHO, made more detailed short-sales data readily available to the public. This makes it possible for companies like Buyins.net to collect, collate, and publish comprehensive reports, and this means that it's now easier to recognize potential short squeezes. A short squeeze occurs when a company's shares are heavily shorted, but then some news or other event (like a great earnings report) occurs that causes massive share buying, driving the stock price higher and in the process putting short-sellers underwater. In effect, it allows long positions to make money at the shorts' expense. Here are some compelling examples. TIVO TAKEOFF
|
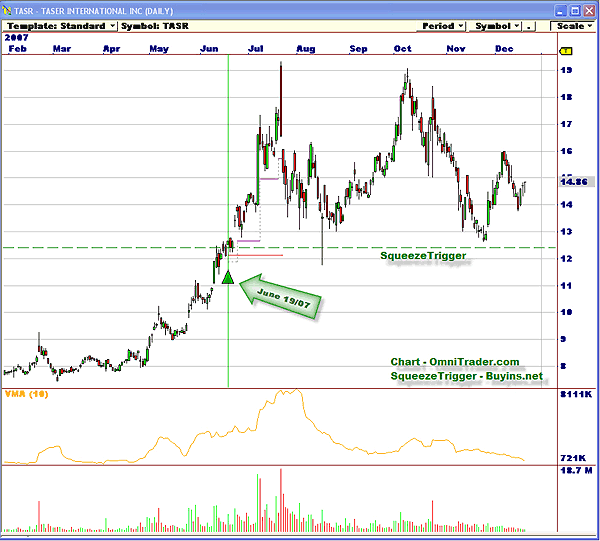
| TiVo moved above its squeeze trigger price of $6.17 on November 29. A squeeze trigger is the short-squeeze line in the sand that tells the market when the long-term average short position starts to lose money. Technically, the squeeze trigger is the volume-weighed moving average of the price at which shorts sold the stock. As the stock rallies back toward this price, the greater the pressure on shorts to cover and the faster it rallies, the more powerful this motivating force. This is clearly evident in the gap and subsequent move in the price of TiVo. There is little doubt that the $0.75 gap between the close November 28 and next day's open was the result of short-covering as shorts fought with buyers to get stock in overnight trading. This short squeeze continued for the next six days before TiVo entered a consolidation phase around $8.25 (see Figure 1). Investors who owned the stock through this period profited handsomely in a classic short squeeze. So what happened to the short position next? As of December 20, short interest had grown to 17.94 million shares or 18.5% of the float, according to the latest data available from Buyins.net. So it appears that if anything, shorts are stubborn. If TiVo remains strong, chances for another short squeeze occurring are good. SHORTS GET TASERED As we see from Figure 2, the breakout was not nearly as explosive as in Figure 1 -- the stock didn't gap up for three more days. But when it finally came, it gapped up $0.79 or 6.25%. Not a bad daily return.
|
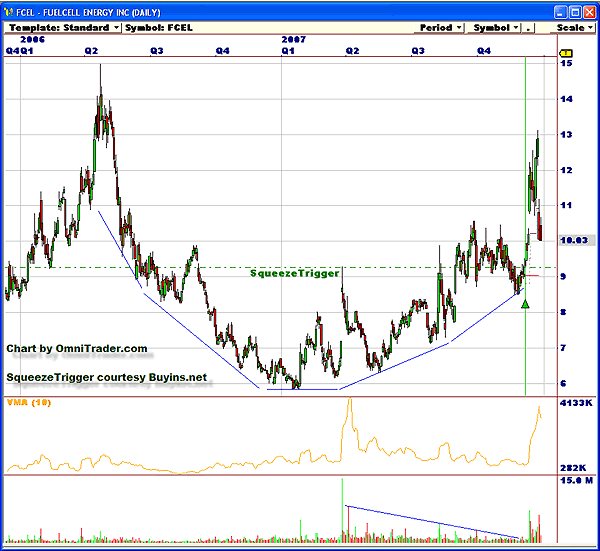
| What caused the gap? A search of the Taser website revealed that two product liability lawsuits against the company had been dismissed on June 20 and 22. That may have been part of it, but the real dynamic could be found in the fact that the stock had moved above its squeeze trigger price of $12.41. Once this line in the sand had been crossed, shorts took it as a signal to cover. Few wanted to incur a loss. FUELCELL: CUP & HANDLE SQUEEZE As we see from Figure 3 that is exactly what happened over the next two weeks, with FCEL closing at $12.88 on December 20, up 35.3% from its December 5th closing price when it broke above its squeeze trigger. But this chart also shows how quickly short squeezes can run their course. By December 27, FCEL was back near $10.
|
| In my experience, short-squeeze breakouts tend to last anywhere from two weeks to three months when the fundamentals and market conditions support the rally. I have seen some last longer than six months. However, this is not a long-term, buy & hold type strategy. It is also best that besides supporting fundamentals, short-squeeze targets also demonstrate supporting technicals (trendline support and/or bullish chart pattern). THE ART OF FINDING THE SHORT SQUEEZE But this won't deter traders and investors who actively search out short squeezes that have found a way of making lemonade out of lemons. In fact, the opposite is probably true -- the more shorts in the market, the greater the number of potential short squeezes. Rather than get caught in a stock that has been driven lower by shorts, patient traders bide their time waiting for their chance to pounce, and that is when the stock starts to rally toward or above its squeeze trigger. Here are the steps to help find short squeezes: 1 Look for stocks with a relatively high short interest as a percentage of the float; 5% is only a suggested threshold. 2 Look for stocks that have rallied and are approaching their squeeze trigger (short squeeze threshold level). 3 Look for fundamental strength or a positive corporate development. A stock that has recently issued some positive earnings news or an exciting new product increases the probability for a strong rally. 4 Look for technical confirmation. Bullish reversal chart patterns like an inverse head & shoulders, double or triple bottom, cup & handle or strong continuation patterns like bullish flags and pennant patterns greatly increase the odds that it will rally. Consolidation patterns like a rounded bottom and areas of strong historical support are other positive patterns. 5 To enter the trade, you have a number of options that include buying the stock outright or buying either an in-the-money or out-of-the-money call (if you are into options). 6 Always use a stop-loss. This will depend on the stock -- in more expensive stocks, this can be a trailing 5% stock but for more volatile inexpensive stocks, the stop-loss might be 10% or higher. The goal is to not get shaken out of your position by normal volatility. A stop of 5% below the squeeze trigger is a good exit point. Ignorance about short positions in the stocks you trade is another example of how what you don't know about the market can hurt you. However, once armed with the appropriate tools and resources, traders can use big short positions to their favor when the right conditions exist. Pitfalls that catch uneducated traders off-guard can become a distinct benefit to the initiated who know how to use them to their advantage. Short squeezes are a great example and while finding them isn't always easy, the effort has the potential to produce some handsome dividends over a relatively short time. |
| SUGGESTED READING Anatomy of a Short Squeeze http://tradesystemguru.com/content/view/131/9/ Phantom Shares - video Coming Up Short On Share Lending Failure is an Option: Impediments to Short Selling and Options Prices DTCC response to naked short selling claims SEC Amends Regulations to Curtail %60Naked' Short Sales Fined by the NYSE Over Short-Sale Violations Overstock Shares Rise on Court Ruling in Broker Suit Hedge Fund's Founder Settle Short-Sale Probe Naked Short selling explained Naked short victim strikes back |
Matt Blackman is a full-time technical and financial writer and trader. He produces corporate and financial newsletters, and assists clients in getting published in the mainstream media. He tweets about stocks he is watching at www.twitter.com/RatioTrade Matt has earned the Chartered Market Technician (CMT) designation.
| E-mail address: | indextradermb@gmail.com |
PRINT THIS ARTICLE

|

Request Information From Our Sponsors
- StockCharts.com, Inc.
- Candle Patterns
- Candlestick Charting Explained
- Intermarket Technical Analysis
- John Murphy on Chart Analysis
- John Murphy's Chart Pattern Recognition
- John Murphy's Market Message
- MurphyExplainsMarketAnalysis-Intermarket Analysis
- MurphyExplainsMarketAnalysis-Visual Analysis
- StockCharts.com
- Technical Analysis of the Financial Markets
- The Visual Investor
- VectorVest, Inc.
- Executive Premier Workshop
- One-Day Options Course
- OptionsPro
- Retirement Income Workshop
- Sure-Fire Trading Systems (VectorVest, Inc.)
- Trading as a Business Workshop
- VectorVest 7 EOD
- VectorVest 7 RealTime/IntraDay
- VectorVest AutoTester
- VectorVest Educational Services
- VectorVest OnLine
- VectorVest Options Analyzer
- VectorVest ProGraphics v6.0
- VectorVest ProTrader 7
- VectorVest RealTime Derby Tool
- VectorVest Simulator
- VectorVest Variator
- VectorVest Watchdog


