

HOT TOPICS LIST
- Strategies
- Stocks
- Buy
- Investing
- Brokers
- Psychology
- Interviews
- Accumulate
- Sell
- Hold
- Spotlight
- Websites
- Candlestick Corner
- Gold & Metals
- Options Trading
LIST OF TOPICS
TRADER'S NOTEBOOK
When And Where To Take Profits
02/01/08 04:25:00 PM PSTby Larry Swing
These five concepts should be considered when developing exit strategies.
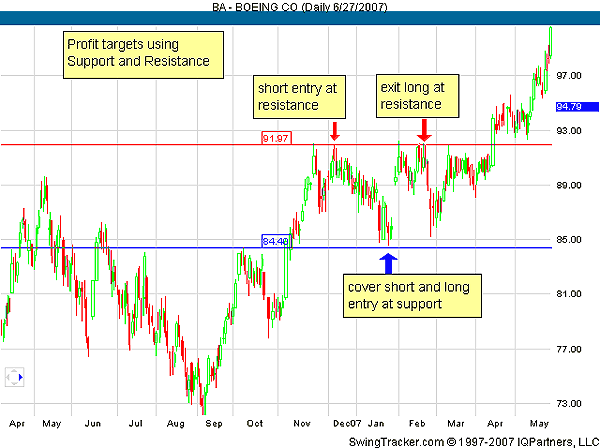
| Many say that it is easier to enter a position than it is to exit one, especially when it comes to taking a profit. Often, it is more painful to watch your profits being left on the table when you take profits too early. But it is just as painful to watch what could have been your profit pass by when you exit your position too late. In truth, exiting a position requires more of an art. So how do you know when and where to take profits? THE FIVE CONCEPTS 1 Support/resistance 1. SUPPORT/RESISTANCE. The first concept uses the nearest support/resistance areas as targets for taking profits. This is probably the most common of all the profit targets discussed since they are the easiest to identify in price charts. Support and resistance areas are usually the short-, medium-, and long-term lows and highs. On an intraday chart the opening and closing prices as well as the gap top and bottoms are considered support and resistance areas. Figure 1 is an example of the support and resistance used to identify entry points as well as exit points.
|
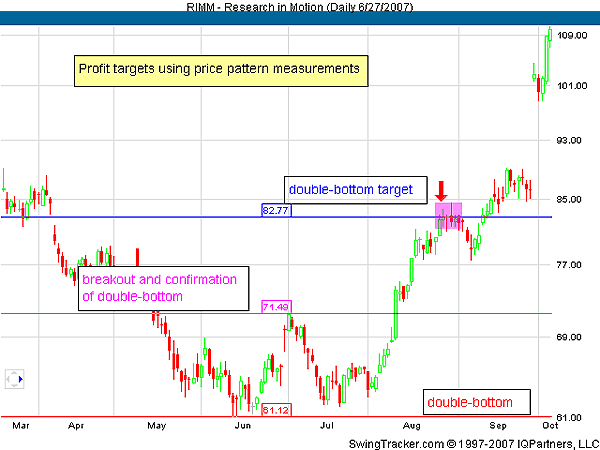
| 2. TARGET MEASUREMENT. The second concept is using price patterns to measure the profit targets. Although this requires more experience and knowledge in understanding and identifying price patterns, measurements from price patterns are invaluable in identifying the dynamics of the market. Since each pattern is different in size and length, the measurements and profit targets will change. Price patterns include rectangles, triangles, wedges, pennants, flags, double tops, and double bottoms. There is a method to measure the price targets after each one of these formations are confirmed by the market. An example of measuring the price target after the formation of a double bottom is displayed in Figure 2.
|
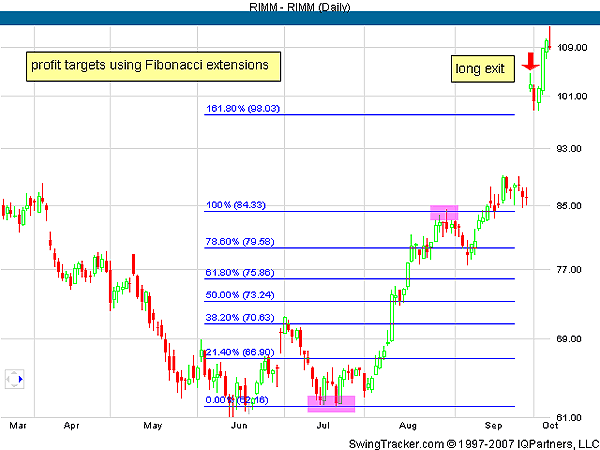
| 3. FIBONACCI EXTENSIONS. The third concept is to use Fibonacci extensions to identify price targets. Most traders use Fibonacci to find pullbacks or retracements to find an entry point. Only a handful of traders bother to look at price extensions to find where prices may continue and stall. Most know the retracement but don't know the extension values. The most common extension levels are 138%, 150%, 161.8%, and 200%. Although these are somewhat arbitrary in determining which level will be the one for prices to stall or reverse, many traders tend to use an area where there is a confluence or cluster that are within a narrow level. On the daily chart of Research In Motion (RIMM) in Figure 3 you can see how Fibonacci retracements may be applied.
|
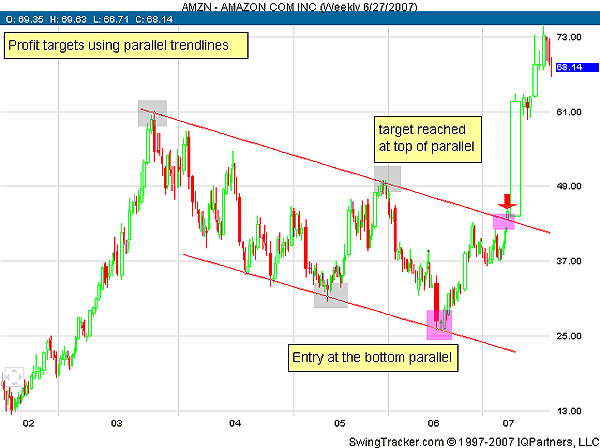
| 4. TRENDLINE CHANNELS. Profit targets can also be determined with the help of parallel trendline channels (Figure 4). It's a simple tool, commonly used to find price projections. All you have to do is draw two parallel trendlines that connect two recent highs and two recent lows. These trendlines are seen as resistance or support points where traders would take profits and/or reverse their position. Even though there's the possibility of prices not stalling or reversing at these points, they serve as guidelines of where to take or cover your positions.
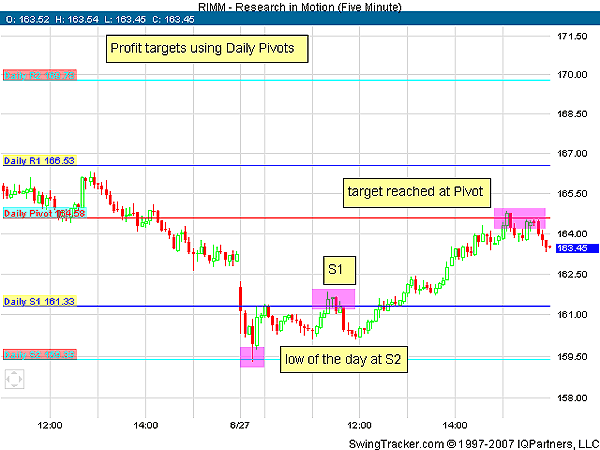
5. FLOOR TRADER PIVOTS. These include the pivot (or the average), resistance 1 (R1), resistance 2 (R2), resistance 3 (R3), support 1 (S1), support 2 (S2), and support 3 (S3). The calculation of these pivot points is easily available. Daytraders often use these pivot points to properly time their profit-taking. In addition to the daily pivot points, weekly and monthly pivots can be used for trading higher time frames by swing and position traders. Floor traders use these numbers daily and electronic traders are now using them to apply to different markets and time frames. These pivots are one of the most useful tools for intraday trading. In fact, many experienced traders swear by them. On the five-minute chart of RIMM in Figure 5 you see an example of applying pivot points.
|
| PROFIT-TAKING I have presented five methods you can apply when it comes to estimating profit targets based on market dynamics. They are not fixed-dollar amounts or points that many traders can set in their programs or strategies. In the ever-changing markets, stops and profit target sizes must change and adapt so you are not stopped out unnecessarily or take profits too early or too late. These targets are a simplified guide to give ideas on how to set profit targets. Study and test them to discover which method works best with the existing strategies you already use for your trading. |
Larry Swing is the president of the day- and swing trading site www.mrswing.com, where free daily articles and videos on education, market analysis, and picks from Swing and other well-known traders can be found.
| Website: | www.mrswing.com |
PRINT THIS ARTICLE

Request Information From Our Sponsors
- VectorVest, Inc.
- Executive Premier Workshop
- One-Day Options Course
- OptionsPro
- Retirement Income Workshop
- Sure-Fire Trading Systems (VectorVest, Inc.)
- Trading as a Business Workshop
- VectorVest 7 EOD
- VectorVest 7 RealTime/IntraDay
- VectorVest AutoTester
- VectorVest Educational Services
- VectorVest OnLine
- VectorVest Options Analyzer
- VectorVest ProGraphics v6.0
- VectorVest ProTrader 7
- VectorVest RealTime Derby Tool
- VectorVest Simulator
- VectorVest Variator
- VectorVest Watchdog
- StockCharts.com, Inc.
- Candle Patterns
- Candlestick Charting Explained
- Intermarket Technical Analysis
- John Murphy on Chart Analysis
- John Murphy's Chart Pattern Recognition
- John Murphy's Market Message
- MurphyExplainsMarketAnalysis-Intermarket Analysis
- MurphyExplainsMarketAnalysis-Visual Analysis
- StockCharts.com
- Technical Analysis of the Financial Markets
- The Visual Investor