HOT TOPICS LIST
- Strategies
- Stocks
- Buy
- Investing
- Brokers
- Psychology
- Interviews
- Accumulate
- Sell
- Hold
- Spotlight
- Websites
- Candlestick Corner
- Gold & Metals
- Options Trading
LIST OF TOPICS
TRADER'S NOTEBOOK
The January Effect
03/03/08 04:40:37 PM PSTby John Devcic
You've probably heard of the Santa Claus rally. What about this one?
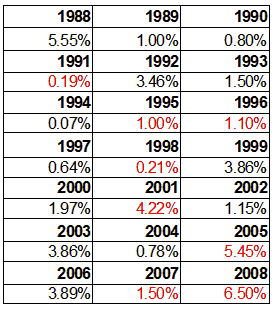
| You have probably heard of the "Santa Claus rally" or "Sell in May and go away." Have you ever heard of the January effect? If you have watched any of the financial news programs or read any of the financial newspapers lately chances are you have probably heard them mention the January effect. You will always hear about it during the last trading week of the year and the first trading week of the New Year. So what is the January effect? Is it just another saying with nothing behind it or is there an actual truth behind this phrase? THE MARKET IN JANUARY The January effect seems to really have the most impact on the small-cap stocks. In order to see if there is any real substance behind the January effect, we have to look at the historical prices of the market. So how did the small-cap stocks fare between the last trading day of December through the fifth trading day of January? The most popular index that tracks the small-cap sector is the Russell 2000. This immediately became the most obvious choice as a benchmark. Figure 1 looks at the performance of the Russell 2000 from 1988 to January 2008. Is there a sharp rise in small-cap prices? Let's find out. JANUARY EFFECT FOR SMALL-CAPS
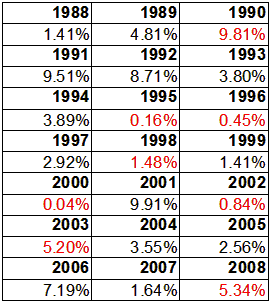
The biggest fall was in 2001 when the Russell got hit hard. That year, the Russell 2000 closed down 4%, but 2002 through 2004 found the Russell finishing higher. However, 2005 saw almost a 5.5% decrease. The worst close happened from the last trading day of December 2007 into January 2008 with a 6.5% close down. There has been talk on the street that the January effect no longer holds substance. If you started looking at the numbers from 2005 on, you could see indeed that could be true. I wanted to know if the January effect had any effect on the Russell 2000 and how it would finish the month of January. Figure 2 illustrates the returns for the Russell 2000 for January. Did the January effect have any real say in how the small-cap sector would finish the month?
The years 1990, 1991, 2000, 2001, 2002, 2003, 2005, and 2007 were the only eight times between 1988 and 2008 that the month of January finished differently from the January effect. If you looked at those numbers a little closer, you would have realized that between 1988 and 1999, this happened only twice. The other six times all happened since 2000. In 1990 during the January effect the Russell 2000 closed slightly higher -- almost a percent higher, actually. January as a whole was really bad for the Russell, however. It was down almost 10%. The year 1991 was the reverse. In 1991 during the January effect the Russell closed down 0.19% but skyrocketed during the rest of the month to close 9% higher. The year 2000 was interesting because while the Russell did close higher during the January effect, it was only down 0.04% for the month. In 2001 during the January effect the Russell closed down 4.22% but it managed to finish the month up almost 10%. But 2002 is a lot like 2000 in that the Russell closed higher during the January effect yet finished almost a percent lower for the overall month. In 2003 the Russell, during the January effect, finished strong, yet this meant nothing as it ended the month down 5%. The year 2005 started off badly. During the January effect the Russell was down almost 5.5% yet it managed to come out of it, finishing up 2.5%. The correlation between what the small-caps do during the January effect and how they will finish the month does exist to some extent, though it seems that in more recent times that is no longer the case. Using the Russell 2000 as a benchmark worked well, but it is after all only one index. I decided to dig a little deeper and see what other indexes I could find. Another small-cap index I looked at was the Standard & Poor's 600 Smallcap Index. The S&P 600 SmallCap Index is made up of 600 companies from various industries. This index is not as old or as popular as the Russell 2000, but it does track the small-cap sector so it fits in with the January effect. Figure 3 shows the returns on the S&P 600 Smallcap Index during the January effect. |
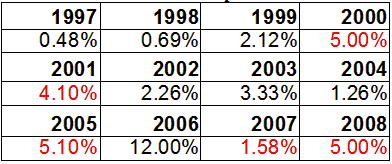
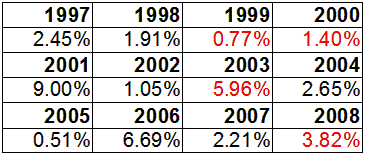
 FIGURE 3: JANUARY EFFECT RETURNS FOR THE S&P 600 SMALLCAP INDEX (1997-2008) S&P 600 SMALLCAP INDEX Is there a correlation between the January effect on the S&P 600 SmallCap Index and the performance of the index during January? The best way to answer that question is to see how may times the January performance differed from the January effect (Figure 4).
The years 1999, 2001, 2003, 2005, and 2007 are the five times that the January close did not follow the lead of the January effect. The most glaring difference is in 2001. During the January effect the S&P 600 was down 4% yet it finished the month of January up 9%. In 2003 the S&P 600 finished January down almost 6% yet during the January effect it was up 3%. On January 31, 2005, the S&P 600 finished the month up a little over half a percent, yet during the January effect it was down more than 5%. In 2007 during the January effect the S&P 600 was down 1.5% and it finished January up a little over 2%. The January effect seems to give us a hint as to how the rest of the month will perform for these small-cap stocks. IS IT STILL VALID? There is talk that the January effect is no longer worthy to follow because more investors and traders know about it. There may be something to that, because the numbers have not been good. That said, the January effect may not be worth ignoring. As illustrated in this article (Figures 1 through 4), what happens during the last trading day of December through to the fifth of January may give us a clue as to how January will finish. Obviously, the current trend is that the January effect is no longer a time when small-cap stocks will go up. Only time will tell if this trend will continue or if somewhere in the future the January effect becomes worth watching again. John Devcic is a market historian and freelance writer. He may be reached at glatko@aol.com. SUGGESTED READING |
John Devcic is a market historian and freelance writer. He may be reached at drmorgus@gmail.com
| E-mail address: | drmorgus@gmail.com |
PRINT THIS ARTICLE

Request Information From Our Sponsors
- StockCharts.com, Inc.
- Candle Patterns
- Candlestick Charting Explained
- Intermarket Technical Analysis
- John Murphy on Chart Analysis
- John Murphy's Chart Pattern Recognition
- John Murphy's Market Message
- MurphyExplainsMarketAnalysis-Intermarket Analysis
- MurphyExplainsMarketAnalysis-Visual Analysis
- StockCharts.com
- Technical Analysis of the Financial Markets
- The Visual Investor
- VectorVest, Inc.
- Executive Premier Workshop
- One-Day Options Course
- OptionsPro
- Retirement Income Workshop
- Sure-Fire Trading Systems (VectorVest, Inc.)
- Trading as a Business Workshop
- VectorVest 7 EOD
- VectorVest 7 RealTime/IntraDay
- VectorVest AutoTester
- VectorVest Educational Services
- VectorVest OnLine
- VectorVest Options Analyzer
- VectorVest ProGraphics v6.0
- VectorVest ProTrader 7
- VectorVest RealTime Derby Tool
- VectorVest Simulator
- VectorVest Variator
- VectorVest Watchdog


