HOT TOPICS LIST
- Strategies
- Stocks
- Buy
- Investing
- Brokers
- Psychology
- Interviews
- Accumulate
- Sell
- Hold
- Spotlight
- Websites
- Candlestick Corner
- Gold & Metals
- Options Trading
LIST OF TOPICS
THE CHARTIST
The Power Of Drawing Tools
03/03/08 04:57:50 PM PSTby Larry Swing
Used long before computers, these simple tools can be key in enhancing your understanding of how price action works.
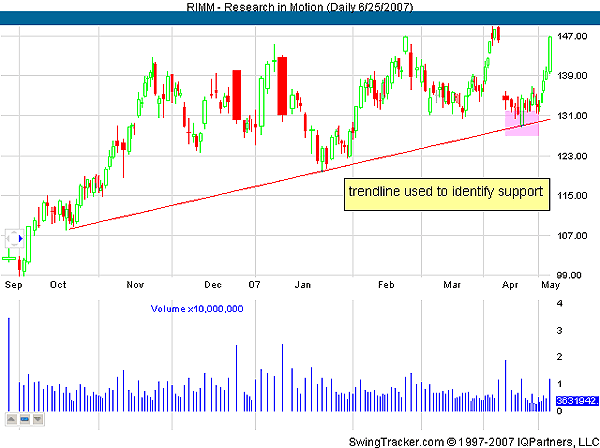
| Indicators are not the only tools that can be used to profit from the market. It's convenient to have the mathematical formula and the charts do all the work for you. However, by confining yourself to using only indicators, you are missing out on another side of technical analysis -- the use of drawing tools. Drawing tools could complement indicators, which would improve the accuracy of your entries and exits. This in turn would increase your profitability. For the most part, the use of drawing tools involves more art than science since most of them are not math-based tools. There are some exceptions, the most common being Gann and Fibonacci lines. Drawing tools are applied on charts manually, which makes them discretionary tools. Here are a few that are useful but effective for charting: 1. Trendlines These are simple tools but can become complex when applied to charts. What is amazing is that prices respond to these drawing tools very well. Actively using these tools will significantly increase your understanding of how price action works. TRENDLINES Trendlines are especially helpful in drawing price patterns such as wedges, channels, pennants and flags, and so forth. Figure 1 is an example of how well prices conform to trendlines.
HORIZONTAL LINES
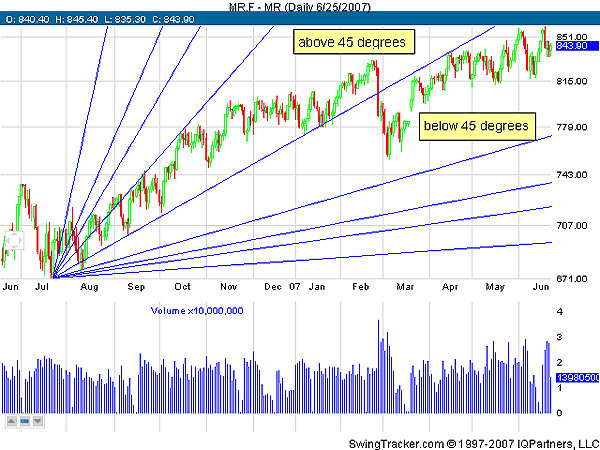
GANN LINES Likewise, in a downtrend, when prices descend below 45 degrees it indicates a strong trend, and when it is above 45 degrees it is not as strong. Figure 3 shows an example of Gann lines.
FIBONACCI LINES
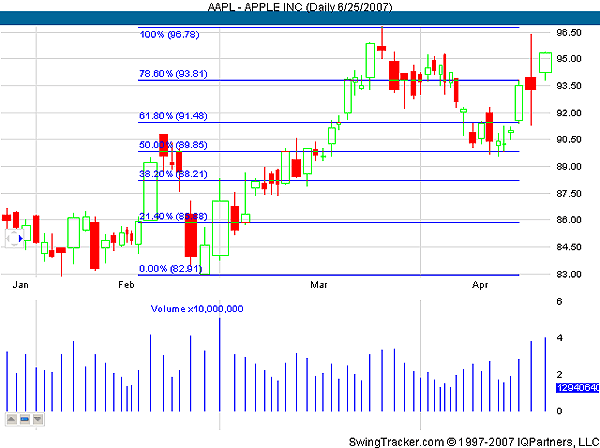
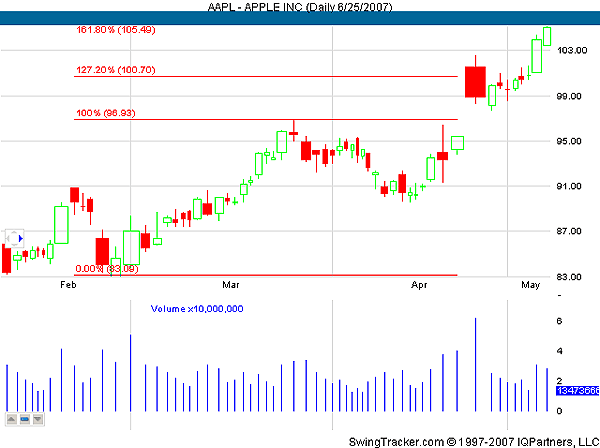
Any percentages above 100% are either extensions or projections of the likely price targets. On the daily chart of AAPL in Figure 5, Fibonacci lines are drawn from the recent high and recent low, retracing back to 50%, before proceeding to the projected 127.2% and 161.9% levels.
SUPPORT AND RESISTANCE LEVELS
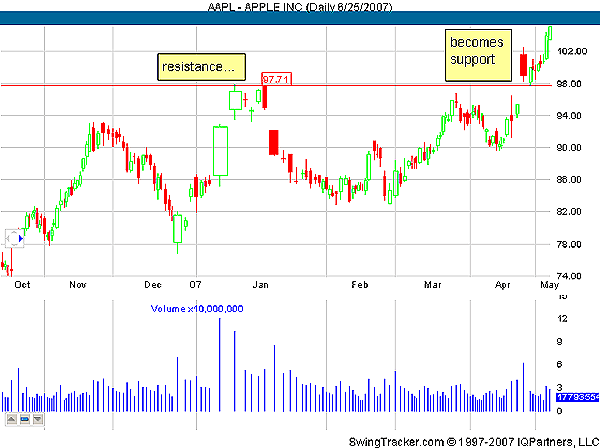
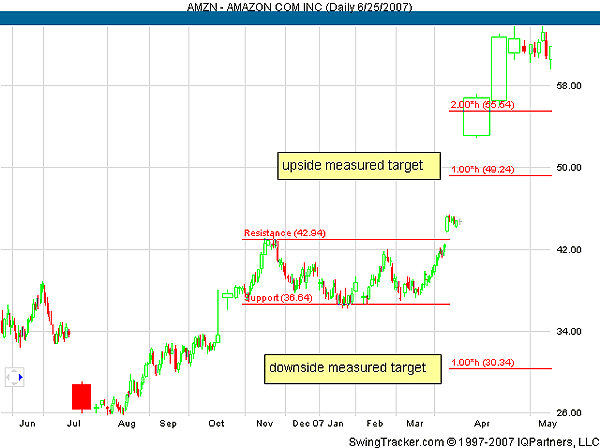
This tool is effective for spotting trading ranges. By placing the resistance line on the highest price of the range and the support line at the lowest price of the range, you can identify a price projection. If a breakout to the upside occurs, an upper price projection is used; if a breakout to the downside occurs, a lower price projection is used. The chart shows the rectangle drawn on a trading range along with the projections on both sides of the range. THE POWER OF THE DRAWING TOOL Larry Swing is the president of the day- and swing trading site www.mrswing.com, where free daily articles and videos on education, market analysis, and picks from Swing and other well-known traders can be found. |
Larry Swing is the president of the day- and swing trading site www.mrswing.com, where free daily articles and videos on education, market analysis, and picks from Swing and other well-known traders can be found.
| Website: | www.mrswing.com |
PRINT THIS ARTICLE

Request Information From Our Sponsors
- StockCharts.com, Inc.
- Candle Patterns
- Candlestick Charting Explained
- Intermarket Technical Analysis
- John Murphy on Chart Analysis
- John Murphy's Chart Pattern Recognition
- John Murphy's Market Message
- MurphyExplainsMarketAnalysis-Intermarket Analysis
- MurphyExplainsMarketAnalysis-Visual Analysis
- StockCharts.com
- Technical Analysis of the Financial Markets
- The Visual Investor
- VectorVest, Inc.
- Executive Premier Workshop
- One-Day Options Course
- OptionsPro
- Retirement Income Workshop
- Sure-Fire Trading Systems (VectorVest, Inc.)
- Trading as a Business Workshop
- VectorVest 7 EOD
- VectorVest 7 RealTime/IntraDay
- VectorVest AutoTester
- VectorVest Educational Services
- VectorVest OnLine
- VectorVest Options Analyzer
- VectorVest ProGraphics v6.0
- VectorVest ProTrader 7
- VectorVest RealTime Derby Tool
- VectorVest Simulator
- VectorVest Variator
- VectorVest Watchdog

