HOT TOPICS LIST
- Strategies
- Stocks
- Buy
- Investing
- Brokers
- Psychology
- Interviews
- Accumulate
- Sell
- Hold
- Spotlight
- Websites
- Candlestick Corner
- Gold & Metals
- Options Trading
LIST OF TOPICS
TRADER'S NOTEBOOK
Daytrading With The NYSE Tick Indicator
03/10/08 02:20:58 PM PSTby Larry Swing
Studying the movements on the tick indicator will help you understand what is really going on.
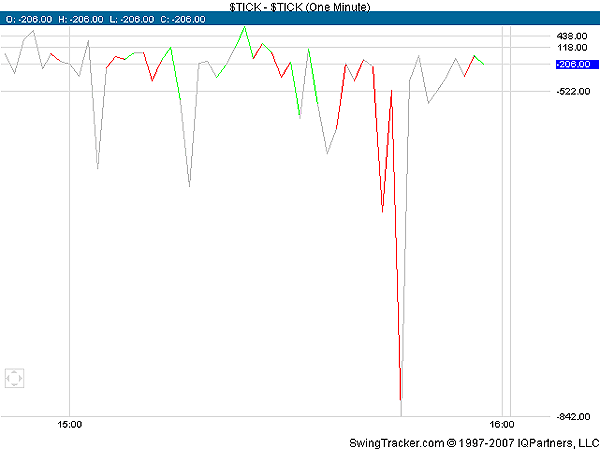
| It's not easy to make a trade within a minute or even a longer time frame like five minutes to one hour. Anyone who has daytraded stocks knows that not knowing which way the market will go or the market sentiment within the next few minutes is the fastest way to go broke. To avoid this situation, I have found that watching the breadth of the broader composites such as the NASDAQ, Dow Jones Industrial Average, or the Standard & Poor's 500 is a fundamental tool used to daytrade effectively. Having an idea of the market sentiment is crucial in seeing when and where the buyers or sellers are coming in. Believe it or not, stocks are not islands and are not random. Participants move in and out for reasons other than prices of stocks. There is always a correlation to some type of data, be it news, earnings, or the action of related stocks. Finding a reason behind the move can give traders an edge. THE TICK INDICATOR APPLYING TICK Once the short-term trend has been established, we look at the NYSE tick chart to find the setup. The best entry, as everyone knows, is buy/short the pullbacks. We turn to the $TICK chart (Figure 1) to look for one extreme of the reading to find the right spot to trade. If the stock is in an uptrend, we look for an extreme negative reading to go long; when it turns upward, we take a long entry. If the stock is in a downtrend, we look for an extreme positive reading to go short; when it begins turning down, we go short. Let's take a look at an example.
|
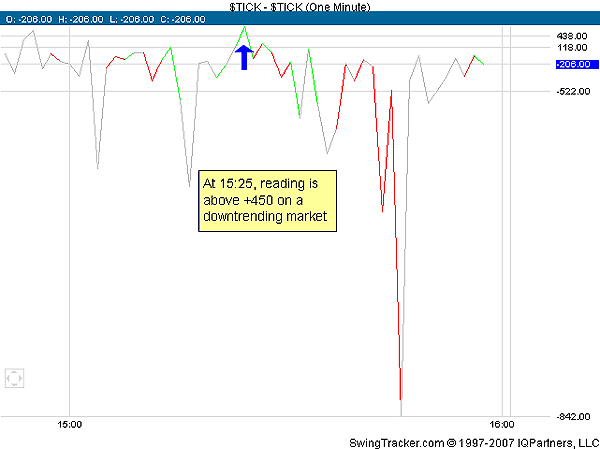
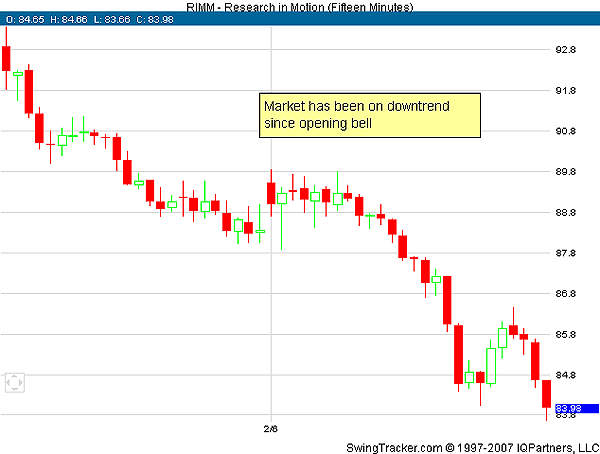 FIGURE 2: PRICE ACTION. You need to keep an eye on the price action as well as the $TICK chart to determine anything about the trend. Looking at the chart of RIMM in Figure 2, we established that the trend has been down since the opening bell. Now, take a look at the $TICK chart. At 3:25 pm the $TICK moves into positive territory (Figure 3).
|
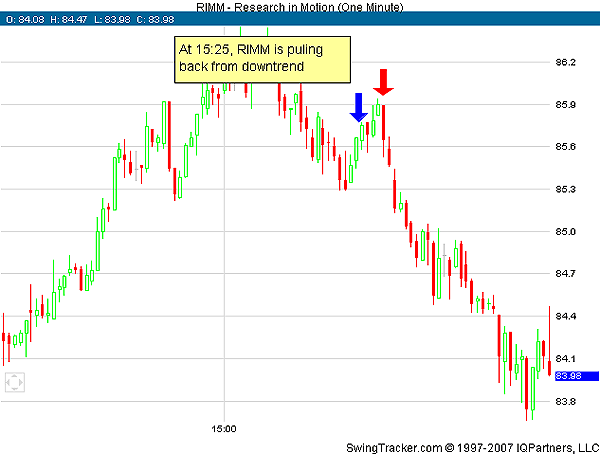
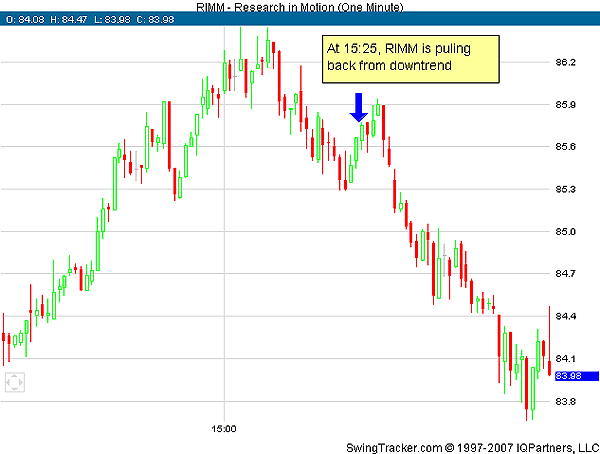 FIGURE 4: PRICE RETRACEMENT. When prices retrace from a particular trend, then an entry on the pullback has a good chance of profitability. Next, look at the price chart to see what the stock price is doing. At 3:25 pm the stock of RIMM has retraced from its downtrend, so a pullback entry is imminent (Figure 4). At 3:26 or 3:27 pm, the $TICK turned down toward a negative reading. With the confirmation of the price action, breaking the low of the previous bar at 3:29 pm, a short entry is taken (red down arrow in Figure 5).
|
| VALUE OF TICK It takes time and experience to know how to use the tick indicator with price action. But as with all other indicators, once you understand what the indicator reveals, it can be useful, especially for daytraders. Often the tick will divert from price action of the individual stocks or instruments. This could be a reversal indicator, and knowing what to do when this happens will help prevent losses. It's a good idea to spend time studying the movements on a tick chart to understand what is going on beneath the numbers. |
Larry Swing is the president of the day- and swing trading site www.mrswing.com, where free daily articles and videos on education, market analysis, and picks from Swing and other well-known traders can be found.
| Website: | www.mrswing.com |
PRINT THIS ARTICLE

Request Information From Our Sponsors
- StockCharts.com, Inc.
- Candle Patterns
- Candlestick Charting Explained
- Intermarket Technical Analysis
- John Murphy on Chart Analysis
- John Murphy's Chart Pattern Recognition
- John Murphy's Market Message
- MurphyExplainsMarketAnalysis-Intermarket Analysis
- MurphyExplainsMarketAnalysis-Visual Analysis
- StockCharts.com
- Technical Analysis of the Financial Markets
- The Visual Investor
- VectorVest, Inc.
- Executive Premier Workshop
- One-Day Options Course
- OptionsPro
- Retirement Income Workshop
- Sure-Fire Trading Systems (VectorVest, Inc.)
- Trading as a Business Workshop
- VectorVest 7 EOD
- VectorVest 7 RealTime/IntraDay
- VectorVest AutoTester
- VectorVest Educational Services
- VectorVest OnLine
- VectorVest Options Analyzer
- VectorVest ProGraphics v6.0
- VectorVest ProTrader 7
- VectorVest RealTime Derby Tool
- VectorVest Simulator
- VectorVest Variator
- VectorVest Watchdog

