HOT TOPICS LIST
- Strategies
- Stocks
- Buy
- Investing
- Brokers
- Psychology
- Interviews
- Accumulate
- Sell
- Hold
- Spotlight
- Websites
- Candlestick Corner
- Gold & Metals
- Options Trading
LIST OF TOPICS
TRADER'S NOTEBOOK
Do The Math The RSI Way
12/08/14 01:54:19 PM PSTby Ron Walker
Even though there are scores of indicators, the relative strength index and the divergence still work.
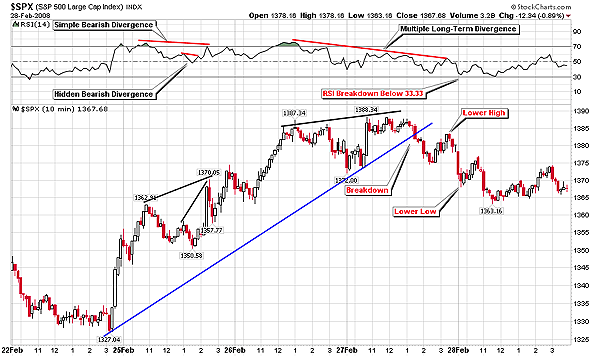
| Your trading system may be based on candlesticks, chart patterns, Elliott waves, Fibonacci retracements, indicators, trends, support and resistance, or any combination of these technical methods. But there is one trading technique that can be used in conjunction with all of these systems, and that is a divergence with reference to the relative strength index (RSI). RSI DIVERGENCES Hayden writes, "A bullish divergence only appears when the existing trend is down. If the trend is clearly down, why are we even thinking of buying? Wouldn't it be more prudent to be looking for a place to get short?" SIMPLE DIVERGENCE HIDDEN DIVERGENCE MULTIPLE LONG-TERM DIVERGENCE As Hayden points out, when "there are three bullish divergences where the price has made three consecutive lower lows while the RSI has made three consecutive higher lows, these higher bullish divergences would be classified as multiple long-term divergences." These multiple points of divergence over a long-term period will ultimately initiate a change in trend. Those trading in an intraday time frame obviously will see multiple long-term divergences more frequently than those trading in a daily time frame. In Figure 1, all of these divergences made an appearance on the 10-minute chart of the Standard & Poor's 500 during the advance from February 22, 2008, until the reversal on February 28, 2008.
|
| RSI RATIOS AND MATH So in the case of a simple divergence, a contratrend in a bear rally may find resistance as it approaches the value of 60. As Hayden points out, downtrends find resistance in the 60 to 66.67 range on the RSI and support near the value of 20, while an RSI uptrend finds support at 33.33 level and resistance at 80. However, these guidelines are not set in stone, and there are exceptions to the rule, but for the most part RSI shouldn't steer too far away from these parameters. There will be times that the indicator varies away from these principles moving into extreme levels from time to time. Both 66.67 and 33.33 have Fibonacci roots and are turning points in calculating the average gain and loss ratio. Hayden notes the importance of the resistance at 66.67 as a pivot point when the relationship between the gain average and loss average ratio changes. Hayden applies RSI math to calculate ratios. From the value of 50 to 66.66, the average gain and loss ratio remains at 1:1, reflecting an equality of up and down days. But as the RSI moves closer to the value of 66.67, the amount of up days is steadily increasing. Once the 66.67 level is reached, the ratio increases by 2:1, meaning that the up average is twice the amount of the down average. Therefore, once the RSI reaches 66.67, the probability of further upside momentum intensifies. Just the opposite is true when the RSI reaches 33.33. When the value of 33.33 is reached, it signals that there has been a shift in the balance of up and down days to the downside. The change in the ratio from 1:1 to 1:2 marks a precise reference point in time, where the momentum shifts in favor of the bears. PRACTICAL USE OF THE RSI
|
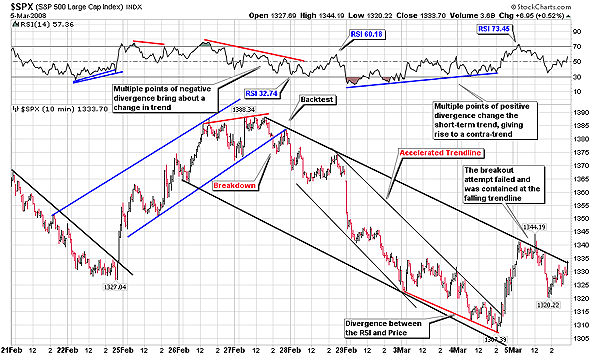
| An attempt was made to test the new declining minor trendline that same day, but the recovery was quickly halted by the bears as the RSI reached the value of 60. The bears wouldn't let the recovery rise higher than an RSI reading of 60.18. Parenthetically, prices came to a screeching halt at the declining trendline once the RSI reached 60.18. Both RSI 60 and the declining trendline served as resistance. Further deterioration occurred for the next three trading sessions that caused an accelerated declining trendline to occur, which resulted in a divergence between price and the RSI. Near the end of the session on March 4, prices managed to break above the accelerated declining trendline after multiple long-term points of positive divergence formed on the RSI. This allowed a contratrend to rise back to the 1340 area, where it stalled the next day at the original downward trendline. The contratrend was thwarted as the more dominant trend reemerged, suppressing the longs in their attempt to drive prices higher. During this particular contratrend, the RSI managed to rise above the values of 66.67 and 70 for a brief moment to 73.45. But the endeavor to change the long-term trend failed when prices didn't confirm the RSI breakout. Prices spiked up above the declining trendline for a moment, immediately after the RSI reached 73.45, but there was no decisive follow-through. Therefore, another breakout attempt was blocked, sending prices lower. Hayden found that most "contratrend rallies do not exceed 50% of the previous decline," which was the case on the 10-minute chart of the S&P 500. |
| SUGGESTED READING Hayden, John [2004]. RSI: The Complete Guide, Traders Press. |
Ron Walker is an active trader and technician. He operates an education website dedicated to the study of technical analysis. The website offers free market analysis with daily video presentations and commentaries. He may be reached through his website at thechartpattern.com or via thechartpattern@gmail.com.
| Website: | thechartpatterntrader.com |
| E-mail address: | thechartpatterntrader@gmail.com |
PRINT THIS ARTICLE

Request Information From Our Sponsors
- StockCharts.com, Inc.
- Candle Patterns
- Candlestick Charting Explained
- Intermarket Technical Analysis
- John Murphy on Chart Analysis
- John Murphy's Chart Pattern Recognition
- John Murphy's Market Message
- MurphyExplainsMarketAnalysis-Intermarket Analysis
- MurphyExplainsMarketAnalysis-Visual Analysis
- StockCharts.com
- Technical Analysis of the Financial Markets
- The Visual Investor
- VectorVest, Inc.
- Executive Premier Workshop
- One-Day Options Course
- OptionsPro
- Retirement Income Workshop
- Sure-Fire Trading Systems (VectorVest, Inc.)
- Trading as a Business Workshop
- VectorVest 7 EOD
- VectorVest 7 RealTime/IntraDay
- VectorVest AutoTester
- VectorVest Educational Services
- VectorVest OnLine
- VectorVest Options Analyzer
- VectorVest ProGraphics v6.0
- VectorVest ProTrader 7
- VectorVest RealTime Derby Tool
- VectorVest Simulator
- VectorVest Variator
- VectorVest Watchdog


