HOT TOPICS LIST
- Strategies
- Stocks
- Buy
- Investing
- Brokers
- Psychology
- Interviews
- Accumulate
- Sell
- Hold
- Spotlight
- Websites
- Candlestick Corner
- Gold & Metals
- Options Trading
LIST OF TOPICS
TRADER'S NOTEBOOK
The ADX And DMI
04/02/08 01:20:47 PM PSTby Brian Twomey
Setting the ADX and the DMI may not forecast trends early, but once forecasted, the strength of the trend will be powerful.
| As a technical indicator, the average directional movement index (ADX) can be a useful tool to both futures and currency traders. Originally developed by J. Welles Wilder as a trend indicator and outlined in his 1978 book New Concepts In Technical Trading Systems, the ADX was originally designed to measure trends and strengths of trends but not to measure the direction of the trend. IN THEORY Fundamental announcements, good or bad, during the course of a trading day can cause the ADX to reach these extreme levels as well as end of the month positioning or even extreme trends. One example of an extreme trend is an interest rate decision or catastrophes such as the latest subprime mortgage problems. But rarely will the ADX reach the optimal numbers of 80 or above. Wilder also wrote that trends occur only 30% of the time, so beware when exhaustion levels occur. This may mean either a trend is finished or a correction is imminent. A resumption of the trend may occur as well. Analyst Charles Schaap recommends considering an entry point at the 20-day moving average if a resumption of the trend continues. ADX readings below 25 indicate a range-bound market; here you would look for higher lows. This is the reaction mode, according to Wilder, or an area of congestion. Look again for a trendline break as further confirmation of a trend. In addition, note that congestion zones can last for as long as 12 to 14 days. But this should be encouraging to traders, as this means a trend is imminent, according to Wilder's original intent for this indicator. Traders should look for trends to begin forming somewhere in the teens to low 20s. Calculating the ADX can be complex because the indicator is nothing more than a moving average determining momentum and the strength of the momentum. Wilder suggested that the ADX be used not as a standalone indicator to make trading decisions, but in conjunction with the directional movement indicator (DMI). But DMI has two components, a blue negative DMI line and a green positive DMI line. Wilder's theory was that when the positive green DMI line crosses the negative blue DMI line, it signifies a long position as long as the ADX is in trend mode, is pointing up, and is above both the DMI lines. The opposite is true regarding DMI. When the negative blue DMI line crosses the positive green DMI line, short positions should be considered as long as the ADX is pointing up and moving. A sideways moving ADX is not a trend; it is a false break. The optimal long position occurs when ADX is above both DMI lines and a trendline break occurs. The inverse is true as well. One drawback to this theory regarding DMI is that a cross one way or another may not signify a solid trend. These are false breaks that can occur, such as when there is an important news announcement during the course of a trading day. If you are using these indicators to make trading decisions, this is why the ADX is critical to use in conjunction with DMI. The ADX verifies the trend and the DMI is used as further support to determine the trend. Again, the ADX must be above the DMI lines for a true trend to ensue. |
| APPLYING IT To calculate the ADX, you take the n-period exponential moving average of DX: ADX = EMA[(+DI -(-DI))]/+DI) + (-DI)), n] The default period for n is 14 and the default for the smoothing period is nine. The 14 simply means 14 trading days of momentum. The DMI is calculated with a DI interval of 20. If you want to catch a move in a faster market, then you can decrease the parameter values. Those who want a true picture of a trend can increase ADX and DMI numbers. The DMI studies automatically display the positive DMI line and negative DMI line at the same time. J. Welles Wilder's purpose for these two indicators was that the ADX be used as an overlay to the DMI. This was because ADX is the moving average of the DMI lines. This is where the smoothing process occurs. ADX smoothes the DMI lines; these numbers are used in standard charting software. But the ADX overlay is not necessarily standard. Both must be used separately and called up on chart studies individually. This will depend on the software package you use. What can be gleaned from this information is not necessarily to make trading decisions using the ADX and the DMI because these indicators are considered lagging indicators. Wilder reasoned that ADX and DMI could be used in all markets and on any time frame charts. Examples will show that this may not be the case. The correct use of these indicators may be a valuable tool in catching trends. A positive DMI cross over the negative DMI with the ADX pointing in the right direction or vice versa is what everybody is interested in. This way, you can test the validity of the trend and catch part of a move in an oversold or overbought market. With the advent of more timely and responsive indicators, traders can catch a trend earlier and have the opportunity for better entry and exit points. This is the assumption since the ADX and the DMI do not appear to be as popular as other indicators. Used properly, however, the ADX and the DMI are quite effective. True entry and exit points may not be perfect, but catching trends can be. It's a matter of semantics and market types traded while using the ADX and DMI.
|
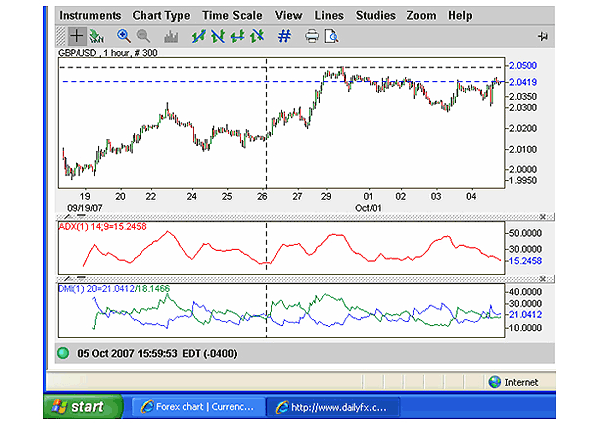
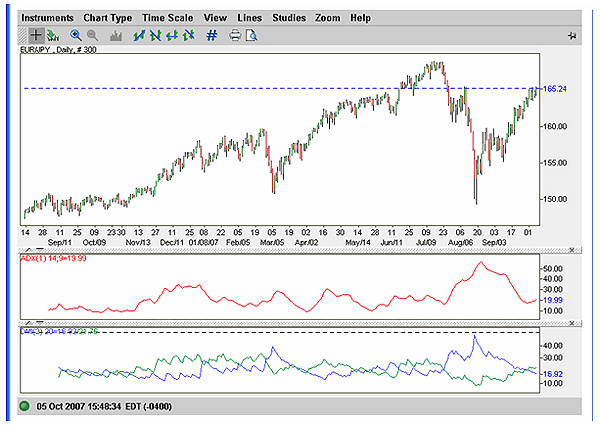
| Take a look at Figure 1. Used correctly, traders would go long when the green DMI lines cross and the ADX is pointing up and exit trades when the ADX has reached exhaustion levels. On the hourly chart of the GBP/USD in Figure 1, it was not until the formal cross was made by the positive green DMI line over the negative blue line that it was clear that an intraday trend was advancing. The ADX didn't respond to this trend until the formal cross was made; only then was a trend established. At the beginning of the trend, the DMI forecasted a range-bound market coming off what appeared to be a long short. The ADX didn't respond until halfway through the advance. The trend lacked strength for whatever intraday market scenario occurred that day. Once the formal DMI cross is made and the ADX is compliant with an indication of strength, follow the advance until the ADX reaches intraday exhaustion. You can exit when the ADX has topped and begins its descent. The second time the green DMI lines crossed the ADX on September 26, 2007, it indicated an early sign of a long position advancing. The ADX fully accepted this scenario due to its early warning sign of strength in this trend. Wilder wrote that markets are trending 30% of the time and range bound 70% of the time. Yet again, today's markets are trending all the time but ADX and DMI together seems to have lost popularity. What appears to be the trend with ADX is not to use DMI with ADX to make trading decisions but to use ADX as a standalone indicator to determine trends. The ADX can be useful in determining an oversold or overbought market, and many can catch an early move, especially when more timely indicators are used. The problem with this scenario? A false break may occur and catch a trader long when he or she should be short. I like the use of ADX and DMI because it is a powerful determinant of forecasting early trends. But when ADX is hovering in the low to high teens and ADX is moving sideways, a trend will emerge. In Figure 2 the ADX and the DMI failed to capture this first trend. The trend was recognized by the ADX halfway through.
|
| Intraday market scenarios may have one explanation. During the second crossover, the ADX and the DMI aligned to forecast a nice trend. The ADX correctly forecasted that strength in this trend existed and early warning signs were evident. Look at the ADX and the DMI in this light. My indicators are set at 14 periods for ADX and 20 periods for DMI. These are standard settings and work well for me. The closer to zero you set these, the faster response time the DMI and the ADX will forecast. But beware of false breaks, as this may occur more often at those settings. Setting the ADX and the DMI at higher periods may not forecast trends early, but once forecasted, the strength of the trend will be very powerful. But you do need to exercise patience. |
| SUGGESTED READING Schaap, Charles B. [2005]. ADXcellence: Power Trend Strategies, StockMarketStore.com. Wilder, J. Welles [1978]. New Concepts In Technical Trading Systems, Trend Research. Daily FX |
Brian Twomey is a currency trader and adjunct professor of political science at Gardner-Webb University.
| E-mail address: | dbcc_twomey@yahoo.com |
PRINT THIS ARTICLE

Request Information From Our Sponsors
- StockCharts.com, Inc.
- Candle Patterns
- Candlestick Charting Explained
- Intermarket Technical Analysis
- John Murphy on Chart Analysis
- John Murphy's Chart Pattern Recognition
- John Murphy's Market Message
- MurphyExplainsMarketAnalysis-Intermarket Analysis
- MurphyExplainsMarketAnalysis-Visual Analysis
- StockCharts.com
- Technical Analysis of the Financial Markets
- The Visual Investor
- VectorVest, Inc.
- Executive Premier Workshop
- One-Day Options Course
- OptionsPro
- Retirement Income Workshop
- Sure-Fire Trading Systems (VectorVest, Inc.)
- Trading as a Business Workshop
- VectorVest 7 EOD
- VectorVest 7 RealTime/IntraDay
- VectorVest AutoTester
- VectorVest Educational Services
- VectorVest OnLine
- VectorVest Options Analyzer
- VectorVest ProGraphics v6.0
- VectorVest ProTrader 7
- VectorVest RealTime Derby Tool
- VectorVest Simulator
- VectorVest Variator
- VectorVest Watchdog


