HOT TOPICS LIST
- Strategies
- Stocks
- Buy
- Investing
- Brokers
- Psychology
- Interviews
- Accumulate
- Sell
- Hold
- Spotlight
- Websites
- Candlestick Corner
- Gold & Metals
- Options Trading
LIST OF TOPICS
TRADER'S NOTEBOOK
The 10-Bagger Prelaunch
04/10/08 10:03:16 AM PSTby Thomas Maskell
Can we grab hold of the 10-bagger right before the stock skyrockets?
| In my previous article, we have explored and discovered how each approach to the 10-bagger (investing, trading, and speculation) has failed to confidently predict their launch. They all offer some help, but none offers all the help we need. So let's take a more eclectic approach as well as reduce our ambitions for these wealth-building stocks. We will combine what we have learned into a comprehensive strategy for buying 10-baggers. This approach will allow us to adjust the strategy to reflect our personality, our new goals, and our confidence threshold. BEHIND THE STRATEGY
|
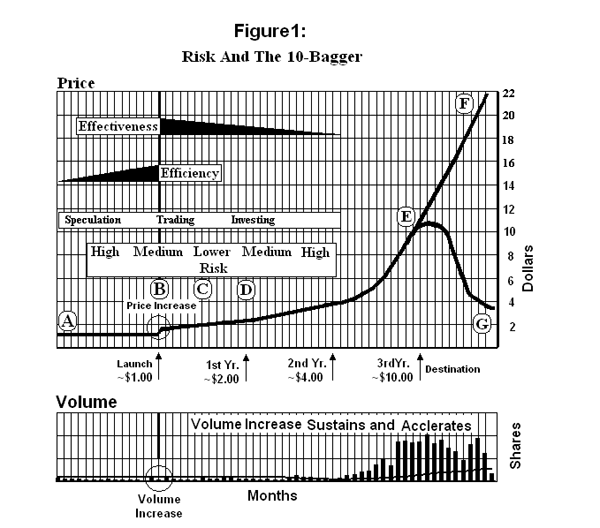
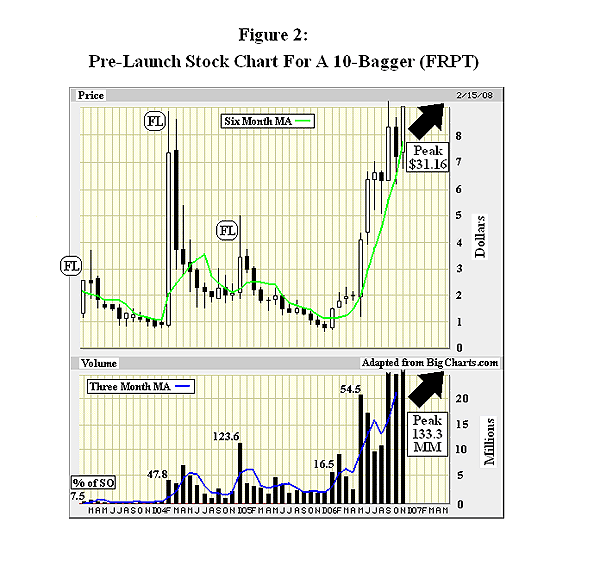
| As illustrated in Figure 1, buying a 10-bagger prior to the launch point (area A-B) carries the highest degree of effectiveness and the risk that our decision will be ineffective (that is, incorrect). This is because the only evidence to its 10-bag potential is speculative. Buying at the launch point (B) reduces risk because the launch provides technical confirmation of the move. However, at the launch point, the effectiveness of a correct buy decision is still high. Since speculators can create false launches (FL), several months of increased chart activity are needed to confirm the launch and provide an additional reduction in risk. This technical confirmation occurs over the period B-C. After about six months into the move (period C-D), the performance of the company (fundamentals) will also begin to confirm the speculators analysis. Thus, buying along the B–C–D line offers a reducing level of risk with only a modest reduction in effectiveness. Beyond point D, both effectiveness and risk begin to deteriorate dramatically. The effectiveness declines because by point D the stock has already doubled, which means that in order for it to be a 10-bagger from point D (your buy point), it must increase to point F. By waiting, we need a 20-bagger from launch to equal a 10-bagger from our buy point. The risk that we will not achieve our goal rises because 20-baggers are less likely to occur than 10-baggers. While Figure 1 measures effectiveness and risk around the launch point, our concern is with the buy point, which brings us back to your personal confidence threshold. Confidence is the opposite of risk and is highest when the risk is lowest. But your confidence level is very personal. Figure 1 only defines the structural risk, but each buyer brings to the game his or her own set of skills and confidence threshold. They define the actual risk. Let's explore this for a moment. On a stock-by-stock basis, the risk is either 100% or zero. It will either be a 10-bagger or it won't. It is not the stock that lies between zero and 100, but you. In essence, your risk factor is how many times you get it wrong at any given point along the A–E line in Figure 1. It is the average of all your decisions. For illustrative purposes, we infer your risk by calculating how many stocks in a defined group actually become 10-baggers. It is based on the percentage of the group, and it is a historical number. Yet in the end, it is your ability to choose from the group that really matters. A random pick from the group will, in the long run, give you a risk level equal to the structural risk of the group. However, we are not picking randomly; we are picking rationally. In essence, we are assembling our own subgroup, and we expect our subgroup to have a lower risk factor and higher confidence level. Thus, your confidence level reflects your picks, not the inherent risk of the group. Finally, Figure 1 also illustrates the relationship between the launch of the 10-bagger and efficiency. Once the stock has launched, the effectiveness of a buy decision will begin to decline. However, if we buy a 10-bagger six, nine, 12, or 24 months into its move, there will be no decline in efficiency. Our expected annual rate of return will be a constant 116%. That is not the case if we buy before the launch point (in the A–B area). Over the life of the move, a 10-bagger bought a year before its launch will cut that annual return to 78%. Thus, efficiency is a function of timing, which affects rate of return, which is a classic efficiency metric. As illustrated in Figure 1, efficiency is an issue for the speculator or the trader who has bought into a false launch. But for the postlaunch buyer, it is not a concern. A STRATEGY The screen: First, we must assemble a list of potential 10-baggers. We will use the data uncovered in the first two articles of this series to build our list. A stock screener like the one found at MSN.com is an essential resource. A good starting set of criteria is the price/sales ratio (under 1.00), stock price (under $1.00), shares outstanding (under 25MM), and institutional ownership (under 25%). This will give you a 10-bagger rich portfolio of stocks. However, we are not done with this screen. We will need to eliminate any companies that are in bankruptcy or in danger of going bankrupt. After all, we are not buying trouble; we are buying 10-baggers. Once we have narrowed our list to financially sound companies, we can begin to apply our speculative skills. If you have the makings of an excellent speculator, you can begin to investigate the growth potential of the company — its markets, products, competitors, strategies, and management. With that in hand, you may choose to make a buy decision at this point, or you could go to strategy step 2. For most of us, without a speculative nature, we will take our screening result and go to the next step. The action: The action is found on the stock charts. We have to be careful here because the action we are observing is the one that occurs before the stock launches. Unfortunately, because of the compression caused by the rapid rise of the stock's price, it is hard to see (after the fact) the chart's action preceding the stock's launch. For that reason, in order to properly see the action in an existing 10-bagger, we must redraw the prelaunch section of the chart. Figure 2 is a redrawn chart for Force Protection (FRPT). It illustrates the false launches (FL) often seen on 10-bag charts.
|
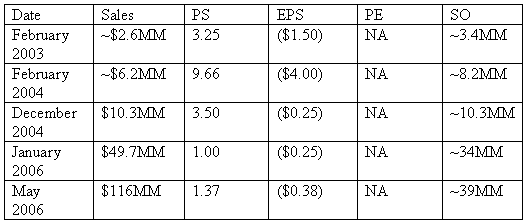
| These false launches push the price of the stock above its six-month moving average (MA) on volume that is substantially above its three-month moving average. FRPT's false launches occurred in February 2003, February 2004, and December 2004. These false launches are troublesome in that they can be costly buys for an aggressive trader and efficiency-draining buys for the investor. The false launch in December 2004 was especially troubling. Here we have a classic breakout (BO) with a price increase from $2.062 to $3.475 on a volume increase of 500%. Buying at the close of that move would bring nothing but trouble. By March 2005 the price was down by 48% on decreased volume, a bullish sign. But the stock didn't sustain the rally that followed that bullish sign. Instead, it declined in price another 50%. By the time it really launched in January 2006, an early buyer would have sold and could very well be shell-shocked and unresponsive to the actual launch that occurred in January 2006. But then that buyer would have missed the point. The point is not the fluctuation in price, but the growth in trading volume. In fact, an agile trader might be able to make a tidy profit on FRPT leading up to its launch in 2006. This may be more easily observed on the weekly or daily charts, but we are not seeking a trade; we are seeking a 10-bagger. The key to that goal is on the volume chart. Prior to the first false launch in February 2003, the largest monthly volume traded was 107,000 shares, just 3.5% of the shares outstanding (SO). During the February 2003 false launch, the volume traded was 254,000 shares, twice the previous high and 7.5% of the shares outstanding, but still not unusual for the stock market, which averages about 7% to 8% of shares outstanding. This false launch was a sign that something was stirring in the realm of FRPT. The false launch in February 2004 involved almost 48% of the shares outstanding. It was an eye-opener, but the postlaunch price did not hold, even though the volume did. The false launch in December 2004 involved 66% of the shares outstanding. This one offered a postlaunch decrease in price on reduced volume — normally a bullish sign. But 10-baggers are not your normal stock. The breakout in January 2006 that traded at 16.5% of the shares outstanding was mild compared to the previous breakouts. However, the January breakout had something the others didn't. It had increased pricing at sustained volume, and it was further confirmed four months later with another big price move on 63% of the shares outstanding. For all its volatility and false signals, by January 2006, it was becoming evident that this was no longer normal volume or just a few speculators pumping up the price. Big players were moving into FRPT — a significant development and a meaningful action. The confirmation: Confirmations occur on and off the chart. Figure 2 provides an excellent example of an on-chart confirmation. The false launches in Figure 2 were followed by a weakening price with and without sustained volume. The launch in January 2006 demonstrates no such weakness. Three months into the move, the average volume traded and the price were both on the rise. The fourth month brings another massive increase in price (113%) and volume (750%). This is clearly a different move than the previous three false launches. While the chart was sending signals that something was afoot, the company's performance was also demonstrating strength. Figure 3 illustrates some key performance ratios for FRPT. While losses are persistent, they are tending downward. But the real clue is in the sales number. It has increased more than 4,300% in three and a half years. This has driven the price to sales ratio down to the point that even the big stock moves in January and May 2006 failed to increase it to the levels obtained during the false launches of 2003 and 2004.
|
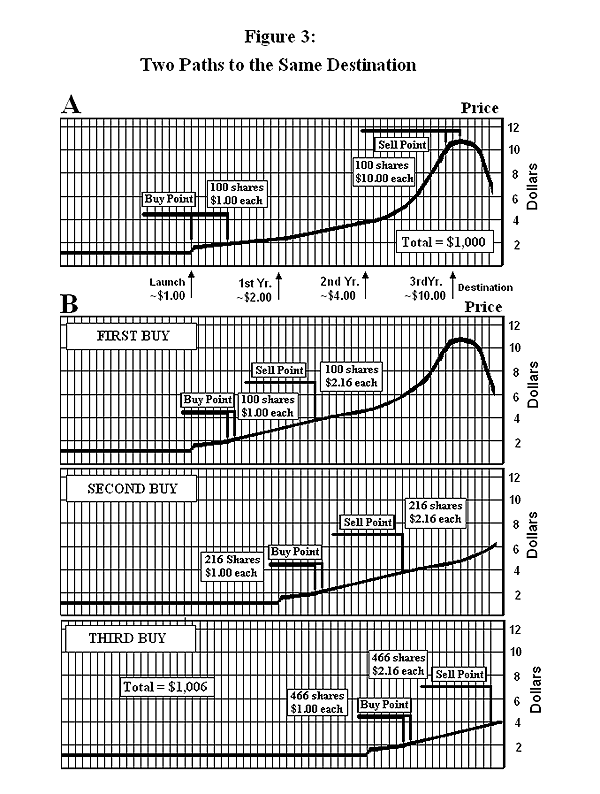
| Further investigation into the fundamentals would have revealed a historically high gross margin that faltered during this growth spurt. A recovery in that key fundamental would provide tremendous operating leverage. If the company could return to their previous gross profit levels, they could easily put 10% to 20% on their bottom line. That growth in profits coupled with their current sales per share of $1.47 would place tremendous upward fundamental price pressure on the stock. That is exactly what occurred. FRPT launched in January 2006 and went beyond Figure 2 to become a $30 stock, a 20-bagger from its closing price on launch. And all the above was observed (and confirmed) by May 2006 when the stock closed just over $4.00 a share, which gave us plenty of time to hop on for the ride. The buy: The final step in our 10-bag strategy is the buy. Sooner or later you have to buy the stock to reap its rewards. But as can clearly be seen in our analysis, there is no single buy point. There are only buying opportunities along the chart with various levels of structural risk. The first of these is area A–B, an area of high risk and lower efficiency. It is also the area where speculators are likely to leap in. For nonspeculators, the volatility in the monthly chart would be off-putting. Nonspeculators must decide if this is the action of a nascent 10-bagger or the manipulations of nefarious market forces. To that decision, the massive volume and high price to sales ratios of the various false launches suggest that this is a stock being put into play by some big players, but it has gotten ahead of itself. It wasn't until the January 2006 move that the price increase, trading volume, price to sales ratio, and sales growth come into alignment, which suggests that its time has come. In hindsight, the forgiving nature of 10-baggers is apparent. Even the most inopportune speculative buy made at the close of the February 2004 false launch would be effective, but its efficiency would be greatly reduced with a compound annual return of approximately 49% from the buy point to the stock's peak price of $30, which was reached three and a half years later. A 49% annual return isn't bad. Of course, traders could do better by hopping in and out of the stock during this period of repeated false launches. Again, this points out the personal nature of the buy decision. Your confidence level is as much about your skill level as it is about the chart. The beauty of the 10-bagger is that it gives everyone a chance to play. The speculator can get in the game along the A–B line (Figure 1). The trader can move in and out along the entire path (A–F) and even pick up a few extra dollars shorting along E–G. Our fundamentalist, who is a little more cautious and a little less agile, can wait for the confirmation found along B–D. There are plenty of buy points on Figure 1 to choose from, with varying levels of structural and personal risk. FINAL THOUGHTS
|
| Of course, whether you ride one 10-bagger to its peak or a series of them across the sweet spot, you will have to sell them to reap your rewards. That is no simple decision, but there is a simple solution. When they reach 10-bag status based on the launch point (not your buy point), sell them. If you want something more complex than that, you'll have to wait for another installment of "In Search of the 10-Bagger." SUGGESTED READING |
Thomas Maskell is a frequent S&C contributor whose recent book, The Complete Guide to Investing During Retirement, provides an excellent primer on investing, trading and speculation in the stock market. It is available nationwide. To comment on this article or his book, contact him at Retireestocks@aol.com or visit his blog at retireestocks.blogspot.com.
| E-mail address: | Retireestocks@aol.com |
PRINT THIS ARTICLE

Request Information From Our Sponsors
- VectorVest, Inc.
- Executive Premier Workshop
- One-Day Options Course
- OptionsPro
- Retirement Income Workshop
- Sure-Fire Trading Systems (VectorVest, Inc.)
- Trading as a Business Workshop
- VectorVest 7 EOD
- VectorVest 7 RealTime/IntraDay
- VectorVest AutoTester
- VectorVest Educational Services
- VectorVest OnLine
- VectorVest Options Analyzer
- VectorVest ProGraphics v6.0
- VectorVest ProTrader 7
- VectorVest RealTime Derby Tool
- VectorVest Simulator
- VectorVest Variator
- VectorVest Watchdog
- StockCharts.com, Inc.
- Candle Patterns
- Candlestick Charting Explained
- Intermarket Technical Analysis
- John Murphy on Chart Analysis
- John Murphy's Chart Pattern Recognition
- John Murphy's Market Message
- MurphyExplainsMarketAnalysis-Intermarket Analysis
- MurphyExplainsMarketAnalysis-Visual Analysis
- StockCharts.com
- Technical Analysis of the Financial Markets
- The Visual Investor


