HOT TOPICS LIST
- Strategies
- Stocks
- Buy
- Investing
- Brokers
- Psychology
- Interviews
- Accumulate
- Sell
- Hold
- Spotlight
- Websites
- Candlestick Corner
- Gold & Metals
- Options Trading
LIST OF TOPICS
TRADER'S NOTEBOOK
Identifying Profitable Setups
04/17/08 05:34:18 PM PSTby Larry Swing
This term is thrown around, but what's it really mean?
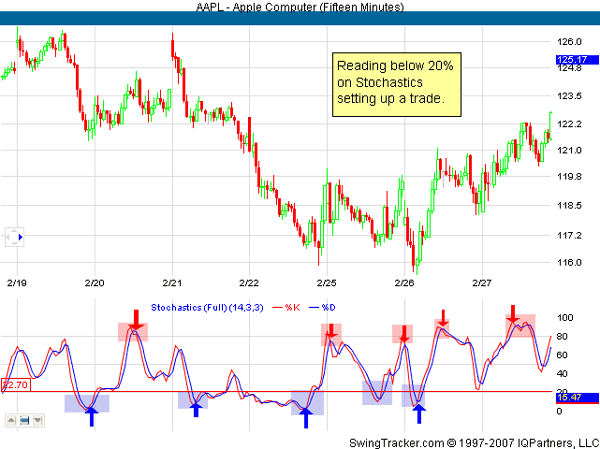
| Lots of words are thrown around in trading terminology, but it's not always easy to understand exactly what they mean. At least that's the way it is for me when it comes to the reality of trading. One word I have difficulty with, in particular, is "setup," mainly because it is an all-encompassing word. So some clarification is needed. WHAT EXACTLY IS A "SETUP"? SOME EXAMPLES
|
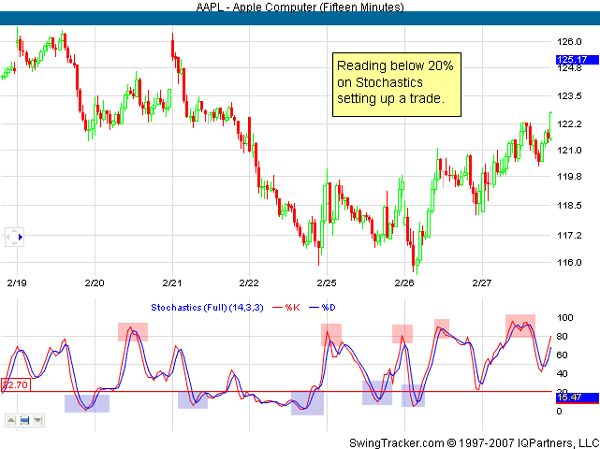
| Another type of setup could be to use the overbought and oversold readings of the stochastic with the crossovers of the two stochastic lines. For example, when both the red and blue lines go below 20%, there is no setup. It is only when the red line crosses above the blue one that a setup to take the long trade is indicated (vice versa for short-trade setups). If you take a look at Figure 2, you can see that there are five long and five short setups. The number of setups would work well for a swing trader, but for others it may be too few or too many.
|
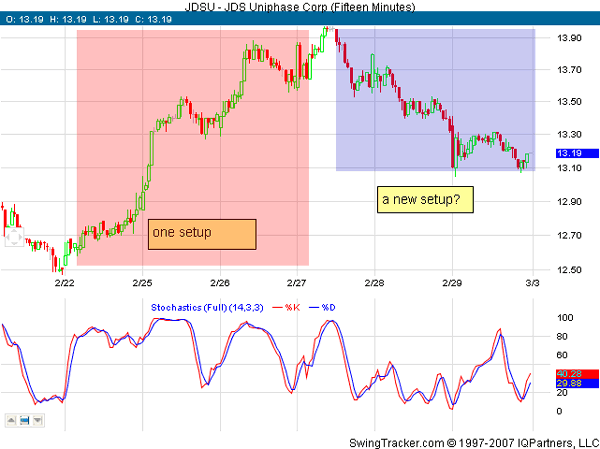
| Another type of setup is based on price action. On the 15-minute chart of JDS Uniphase Corp. (JDSU) in Figure 3, you see an example of such a setup. One setup (shaded in pink) is a bottom, from where a long setup is created till a top is formed. After that, a short setup is created.
|
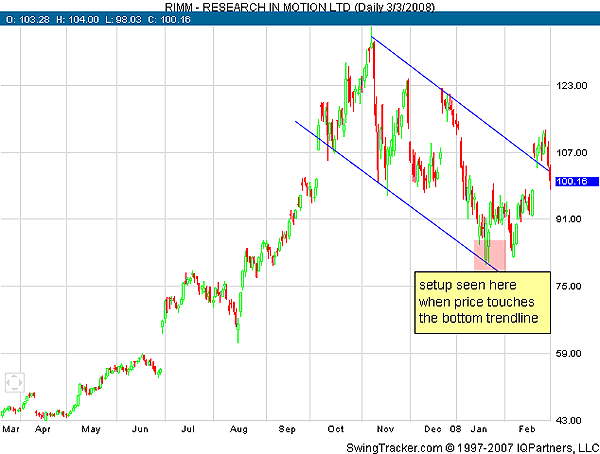
| It is possible to assign one setup to a single pattern or a single movement of the market, either in a downtrend or an uptrend. Basically, a trader can decide that a market top for him is a setup and there will be no others for him until another market top appears. For pattern traders, a triangle breakout is a setup and there will be no others for them until another triangle (or pattern) and prices break out of it. In Figure 4, you see a pattern setup. Here, the pattern is a price channel. When prices touch the bottom or top of a price channel, it could be a setup to enter or exit a position.
|
| HOW MANY IS TOO MANY? By identifying one setup from the next, the trader can evaluate how many trades there are in a setup or how many setups there are in a day. This would give an idea of how many trades he should be making per day in order to avoid overtrading. In addition, if he can identify the maximum number of trades he's going to take, this should eliminate taking too many trades from just one setup. By spreading out his trades, he has more opportunities to profit from a setup that will possibly bring him back into the black. SUGGESTED READING |
Larry Swing is the president of the day- and swing trading site www.mrswing.com, where free daily articles and videos on education, market analysis, and picks from Swing and other well-known traders can be found.
| Website: | www.mrswing.com |
PRINT THIS ARTICLE

Request Information From Our Sponsors
- StockCharts.com, Inc.
- Candle Patterns
- Candlestick Charting Explained
- Intermarket Technical Analysis
- John Murphy on Chart Analysis
- John Murphy's Chart Pattern Recognition
- John Murphy's Market Message
- MurphyExplainsMarketAnalysis-Intermarket Analysis
- MurphyExplainsMarketAnalysis-Visual Analysis
- StockCharts.com
- Technical Analysis of the Financial Markets
- The Visual Investor
- VectorVest, Inc.
- Executive Premier Workshop
- One-Day Options Course
- OptionsPro
- Retirement Income Workshop
- Sure-Fire Trading Systems (VectorVest, Inc.)
- Trading as a Business Workshop
- VectorVest 7 EOD
- VectorVest 7 RealTime/IntraDay
- VectorVest AutoTester
- VectorVest Educational Services
- VectorVest OnLine
- VectorVest Options Analyzer
- VectorVest ProGraphics v6.0
- VectorVest ProTrader 7
- VectorVest RealTime Derby Tool
- VectorVest Simulator
- VectorVest Variator
- VectorVest Watchdog


