HOT TOPICS LIST
- Strategies
- Stocks
- Buy
- Investing
- Brokers
- Psychology
- Interviews
- Accumulate
- Sell
- Hold
- Spotlight
- Websites
- Candlestick Corner
- Gold & Metals
- Options Trading
LIST OF TOPICS
TRADER'S NOTEBOOK
Using Bollinger Bands With Parabolic SAR
04/30/08 02:43:15 PM PSTby Brian Twomey
Parabolic stop and reverse used in conjunction with Bollinger bands work well to catch a trend. Here's how.
| This year marks the 25th anniversary of Bollinger bands. Facing a limited number of indicators in use back then, John Bollinger built on the concept of trading bands and devised his own, set at standard deviations to measure volatility of prices. What this measures is bandwidth — that is, where the bands will be located above and below prices. So each band is set above and below a 20-day simple moving average with a standard deviation of 2.0. These days, setting bands at 20-day simple moving averages with a standard deviation of 2.0 is standard and the norm for charting this indicator. A misconception comes into play when traders don't adjust the bands to match their trading objectives. Short-term traders may consider a 10-day simple moving average, while longer-term trend traders may employ a 50-day simple moving average. Standard deviations must be changed to reflect the average of prices, of which simple moving averages are nothing more. This doesn't give traders specific direction, only where prices are at any given time. John Bollinger recommends two standard deviations with a 20-day simple moving average, 2.1 standard deviations with a 50-day simple moving average, and a 1.9 standard deviation with a 10-day simple moving average. This reflects where upper and lower bands will be set (the bandwidth). What traders want to capture is the volatility of prices to determine where prices have been and where prices sit at present, not where they are going. The upper and lower bands will do this. So the bandwidth is set in relation to volatility of prices. For the most part, prices trade within the bands. The original theory was that when prices hit the upper band, this signified an overbought market so a sell position would be employed. Conversely, if price hit the lower band, this represented an oversold situation and a buy position would be instituted. But if traders were to rely on this concept alone, traders would find themselves in trouble every time. The overbought and oversold situations may be nothing more than continuation patterns, so a retracement or consolidation may be needed before the next leg of the pattern ensues. In this instance, the bands would expand or contract based on volatility alone. Remember, the purpose of Bollinger bands is to measure volatility. The bands will expand and contract based on volatility of prices and volatility only. Prices become volatile due to a new high or low or due to an economic announcement that may be out of sync with market expectations. In this instance, the bands would expand to reflect volatility. The lower and upper bands would follow this volatility. Bollinger bands may remain stable in normal market conditions, but volatility may also mean the next leg of price patterns is consolidation, so the bands will contract. To generate buy and sell signals, John Bollinger recommends using Bollinger bands with another indicator, such as J. Welles Wilder's relative strength index (RSI). The RSI would have confirmed a buy or sell signal, or an overbought or oversold market when prices hit the upper or lower bands. Traders may find themselves struggling with Bollinger bands because many believe that statistically, the price is two standard deviations away from price and price must revert back to the mean, the average. This is a false assumption. Since the introduction of Bollinger bands, many traders have become quite creative with its many uses. Some will use 10- and 20-day simple moving averages within the bands, while others will use moving average convergence/divergence (MACD) in lieu of RSI. This can be done because Bollinger bands can be used accurately in any market and time frame. |
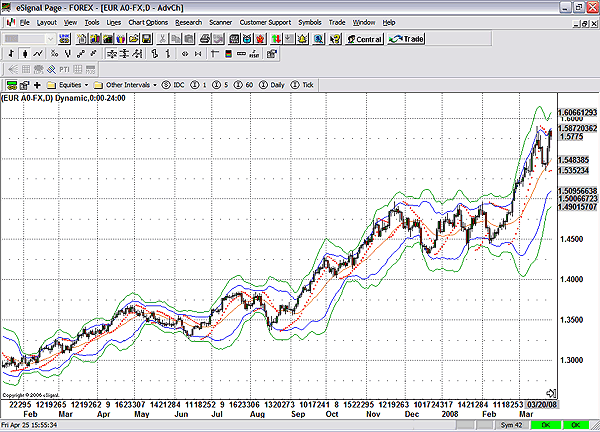
| PARABOLIC SAR My preference is to use double Bollinger bands with a parabolic stop & reverse (SAR). Parabolic SAR is another indicator devised by Wilder and highlighted in his classic New Concepts In Technical Trading Systems. The term "parabolic" comes from the curved dots that look like weird-shaped parabolas. With double bands, the first band is set at the standard 20-day simple moving average with two standard deviations. The second band is set at the normal 20-day simple moving average with three standard deviations. Traders may want to employ the second band at a 10-period simple moving average with a 1.9 standard deviation. Either way, what traders want to capture is the full volatility of the market on short and longer time frames. Normally, if prices fall outside of the first band and hits the second band on longer time frames, what may be occurring is an oversold or overbought market. But confirmation is needed, as well as where a likely entry or exit point would be. Bollinger bands are not equipped to point to an entry or exit area, nor will they give an indication as to where support and resistance levels are. It is difficult to catch a trend with Bollinger bands as a standalone indicator. This is where parabolic SAR comes in. Using the curved dots of the parabolic SAR that follow prices, if the dots are above the price, traders go short because it indicates the market is overbought. If prices are below the price, it means you should consider going long because the market is oversold. When the dots change from an upper to a lower or vice versa, you should consider taking profits. You can now stop and reverse your position. As long as the dots move in the same direction as the trend, traders should ride the trend until a reversal is evident. Used correctly, parabolic SAR is a useful and reliable indicator, especially useful for catching and riding long trends (Figure 1).
|
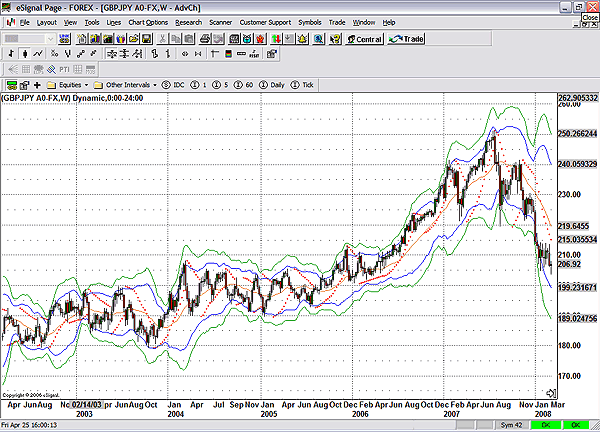
| Parabolic SAR works well with short positions as long as the dots follow prices down; dots should always follow prices up on long positions. Note this up/down scenario. Trends occur only when the dots have angles either up or down. This is represented by small dots with an angle; be careful with thick horizontal dots. This usually represents a rangebound market, a weak trend, or indecision. At times, these horizontal dots may serve as strong support or resistance. Traders should exercise caution until the trend is evident. Trending markets have small dots close to prices and are angling up or down. Dots that are far away from prices may not indicate a trend, showing indecision in the market. Parabolic SAR works best on longer-term charts such as a weekly chart (Figure 2), but it is still useful on hourly charts coordinated with a daily chart as long as the trend is identifiable.
|
| A discrepancy may occur when the daily chart has an up dot and the hourly chart has a down dot. In such a case, traders would be better served to wait for the hourly chart to confirm the daily. You would do the same when coordinating between a daily and weekly chart. The far time frame of the weekly does not always have to correlate with the daily, but it does help. Keep in mind that when a trend reversal is seen, prices will accelerate toward the dot. This may not necessarily mean a change in the direction of the trend; that will only happen when the dots change. When this happens, it is time to bail out and take profits. CATCH THE TREND Bollinger bands and parabolic SAR can be used in rangebound markets as well as trending markets, but the criticism regarding parabolic SAR is that it is least effective in rangebound markets. Dots move in relation to price. If there is no price movement, there are no dots, but Bollinger Bands will find contractions of the bandwidth in rangebound markets. So some validity is evident with this argument. Note, however, that these two indicators can be used in any market on any time frame and can be quite effective. |
Brian Twomey is a currency trader and adjunct professor of political science at Gardner-Webb University.
| E-mail address: | dbcc_twomey@yahoo.com |
PRINT THIS ARTICLE

Request Information From Our Sponsors
- StockCharts.com, Inc.
- Candle Patterns
- Candlestick Charting Explained
- Intermarket Technical Analysis
- John Murphy on Chart Analysis
- John Murphy's Chart Pattern Recognition
- John Murphy's Market Message
- MurphyExplainsMarketAnalysis-Intermarket Analysis
- MurphyExplainsMarketAnalysis-Visual Analysis
- StockCharts.com
- Technical Analysis of the Financial Markets
- The Visual Investor
- VectorVest, Inc.
- Executive Premier Workshop
- One-Day Options Course
- OptionsPro
- Retirement Income Workshop
- Sure-Fire Trading Systems (VectorVest, Inc.)
- Trading as a Business Workshop
- VectorVest 7 EOD
- VectorVest 7 RealTime/IntraDay
- VectorVest AutoTester
- VectorVest Educational Services
- VectorVest OnLine
- VectorVest Options Analyzer
- VectorVest ProGraphics v6.0
- VectorVest ProTrader 7
- VectorVest RealTime Derby Tool
- VectorVest Simulator
- VectorVest Variator
- VectorVest Watchdog


