HOT TOPICS LIST
- Strategies
- Stocks
- Buy
- Investing
- Brokers
- Psychology
- Interviews
- Accumulate
- Sell
- Hold
- Spotlight
- Websites
- Candlestick Corner
- Gold & Metals
- Options Trading
LIST OF TOPICS
TRADER'S NOTEBOOK
The Dollar Index
06/10/08 02:30:09 PM PSTby Brian Twomey
The dollar is still hanging in the balance without a clear direction.
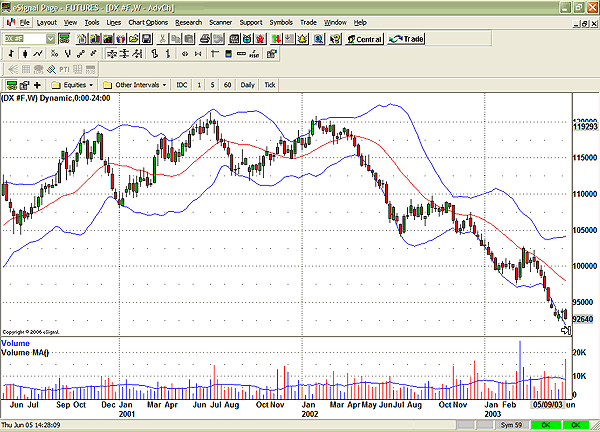
| Between 2001 and 2002, the dollar index (DX) that trades on the New York Board of Trade peaked into a near-triple top at about 120 (Figure 1). The actual values were 119.53 and 119.73. Since the last top at 120 in 2002, the index has been in a long-term downtrend, currently trading at the last quote of 73.50 with long bullish engulfing candles at its bottom. The euro, which is the dollar opposite, has been in a long-term uptrend since the dollar index peaked in 2002 and almost broke its historic barrier at 6.000 from a starting point of about 1500. The dollar-bloc currencies, as represented first by the Japanese yen, was trading at its peak at about 128 in 2002 and is now trading in the high 104s. The Canadian dollar and the Swiss franc had been in long-term downtrends since 2002. Since 2002, the dollar opposites have been in a long-term uptrend due in part to the commodity boom we are experiencing in the markets and due to the downtrend of the US dollar. Australia, New Zealand, and the Canadian dollars are considered commodity currencies because they are not only heavily dependent on exports but they export commodities such as Canadian oil, New Zealand dairy products, and Australia metals and bananas, to name just a few. What can you glean from this information? You can discover a possible dollar bottom and the start of a long-term uptrend, a significant opportunity for traders in all markets. This is because, at present, world economic fundamentals as well as technical chart levels dictate a change. THE FUNDAMENTALS In the Bretton Woods conference of 1944, what the world tried to accomplish was a uniform trading system and the first-ever coordination of a monetary system. Forty-five nations agreed to the Bretton Woods agreement. All world currencies were pegged to the dollar with a fixed exchange rate based on the gold standard. Simply, the gold standard meant a fixed $35 per ounce price of gold with a 1% allowable deviation, up or down, in prices. The price of the dollar was fixed at $100. This system broke down over a 25-year period because the United States depleted its $20 million in gold reserves, the price of gold had trouble achieving its $35 base, and the system had violators as well as inflation for many nations. So President Richard Nixon, without warning, took the US off the gold standard. Before this actually occurred, however, the US and its 10 major trading partners adopted the G-10 index. The G-10 index was used to analyze how changes in the foreign exchange value of the dollar influences the US's international trade. These nations traded based on trade shares from the index. The more valuable a trade partner was to the US, the more trade shares a nation would trade. But this system, too, broke down. So a new index was adopted. This new index increased the number of trading partners to 26 nations and changed the trade share formula. The scheme measured competitiveness of US goods in the US and in foreign markets. Weights were changed annually to reflect changes in trade patterns. Because of the adoption of the euro in 1999, this index had to be revised again because of the difference in trade patterns and currency distributions. Today, the Atlanta Federal Reserve Board's dollar index is responsible for its own dollar index to measure trade. They have the domain when it comes to US trade. The differences between this index and previous ones are the number of nations, and the goal of the index is to better measure and understand trade flows and capital flows in and out of the US. The idea is to measure trade, not in weighted currencies but weight on capital flows and trade. Nations that belong to the index must be a developed nation with a low inflation rate, similar to those rates in the US. Trade rates are calculated each day at 12 noon, signed off by customs and certified by the New York Federal Reserve Board. So transactions are reported each day on the New York Federal Reserve website. Nixon's surprise announcement to take the US off the gold standard led to the 1971 Smithsonian Accord. In this, a group of 10 nations, our largest trading partners, agreed to appreciate their currencies against the dollar. This agreement lasted almost two years, until 1973. When this agreement failed, this led the world down the path of free-floating currencies. First, however, nations began intervening to appreciate their currencies based on their trade flows to realize profits. It was a basic economic war for a time, costing nations fortunes for intervention. Second, the world agreed to keep their currencies free-floating within a 15% trade band up or down, which again failed. Now, we have the New York Board of Trade (NYBOT) dollar index, where currencies are allowed to free-float on exchanges. The value of the dollar is now based on a basket of six currencies that happen to represent that of our largest trading partners -- euro, yen, British pound, Canadian dollar, Swiss franc, and the Swedish krona. So the value of the US dollar is a weighted geometric mean that trades every trading day on the NYBOT and is allowed to have values as markets dictate based on economic fundamentals. Now let's move on to economic fundamentals. We must go back to President Franklin Roosevelt's policies of the 1930s to figure out that an economy cannot deflate its way out of an economic problem because prices for our basic goods become too expensive. Roosevelt reinflated his way out of a falling dollar and the economy recovered. A dollar that has fallen as much as the US dollar has can only create the asset bubbles that have further caused us harm as those bubbles burst. And that bubble finally burst in the housing market that led to a worldwide housing problem not just in the US. So they lowered interest rates and weakened the value of the dollar further. What a weak dollar can do for the US, however, is increase exports and ensure US companies earn a profit by converting expensive dollars to an overpriced euro and British pound. First-quarter exports rose 0.7% in the last reporting period while the factory orders index was up 1.4% from -0.9. If transportation is excluded from this equation, factory orders were actually up 2.2%, a healthy sign. Another sign of a turnaround is the $220 billion or so inflows from foreign central banks since the start of this year. This is another healthy sign of a turnaround, as this reflects the rising bond prices since the last rate cut and the dollar turnaround. Bond prices are almost at the 4% mark, a milestone in the recovery process if those prices can break and hold. Ten-year bond prices hit 3.859 from 3.769 at last Friday's nonfarm payroll day while the two-year bonds hit 2.45 from 2.37. Institute for Supply Management (ISM) numbers, which measure two components, service and manufacturing, dipped to 49.5% from 49.6% last month, which means they are still holding steady. Wholesale inventories are -0.5 from 1.1%. Trade balance is still off $61 billion from $62.3 billion, but an improvement. This means the US economy is not in recession but is holding steady. This is positive for the dollar. But how would a trader know?
|
| DOLLAR POSITIVES Look at the high price of the euro, the British pound, and Australia and New Zealand dollars. All have had a long runup in prices with rising economies, rising wages, rising consumer price numbers, rising consumer and business sentiment, and all have increased interest rates into strengthening economies. New Zealand's interest rate is 8.25% but the economy is showing signs of faltering. That's a positive dollar sign. Australia's interest rate is 7.25% with a steady to faltering economy. England had an interest rate of 5.5%, but they have since cut back to 5.0% and expectations are for a further cut to 4.75% due to poor economic releases over a period of time and another faltering economy. Not only that, Japan's economy is in a deflationary contraction where prices are so high for all goods that their economy can't handle another piece of bad economic news. With an interest rate of 0.5%, the Japanese can't raise rates due to a negative economic situation. They are export-dependent, but the high price of food and energy is worsening the situation. With a weak dollar comes a high food and energy price, since these two categories trade opposite each other. This also means we are importing inflation into oil-producing nations. More than one OPEC nation has recommended shifting out of US dollars and moving toward a basket of currencies, beginning with the euro. DOLLAR TURNAROUND?
|
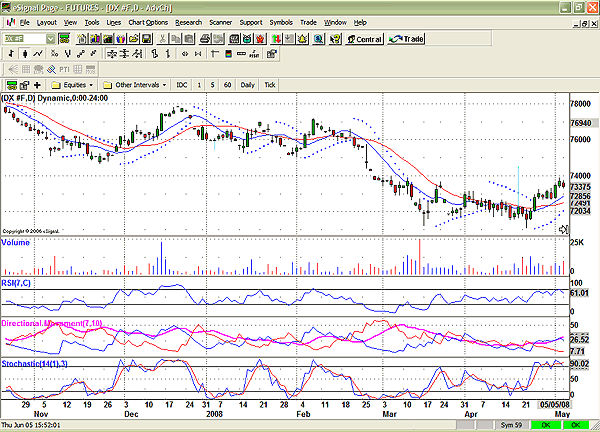
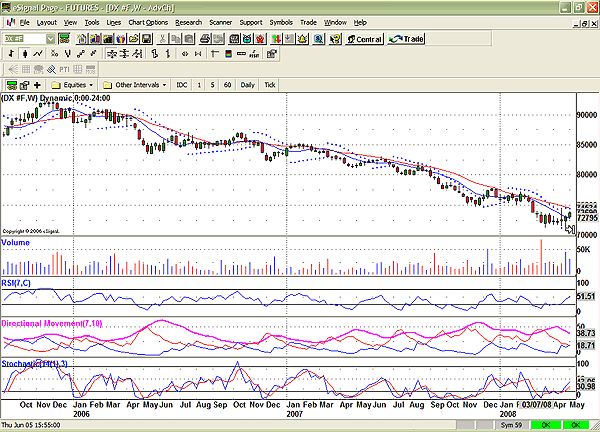
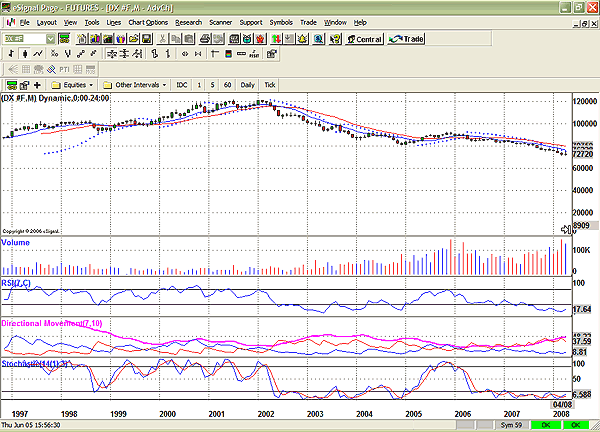
 FIGURE 1: THE DOLLAR INDEX. Between 2001 and 2002, the dollar index (DX) peaked into an almost triple top at about 120. Charts currently point to a correction unless price action and indicators can give a better signal. From the dollar charts, it appears the dollar bottomed at 71.5 with strong supports from recent candles and closed last at 73.5 on the daily chart with long bullish candles and increased volume. The daily charts (Figure 2) show a positive crossover of the 10- and 20-day simple moving average, while it appears the dollar broke the 10-day average on the weekly (Figure 3) and was about to break on the monthly (Figure 4), but resistance is at about 79 at the descending 20-day simple moving average on the weekly and monthly. |
 FIGURE 2: DAILY CHART. Here you see a positive crossover of the 10- and 20-day simple moving average, the parabolic SAR is pointing up, RSI, DMI/ADX, and slow stochastic look like they are pointing up.
Parabolic stop and reverse (SAR) points down on the weekly and monthly with resistance at about 76. Parabolic SAR is, however, pointing straight up on the daily chart. There is a chance the relative strength index (RSI) will continue moving up. The directional movement index (DMI) and the average directional movement index (ADX) are rising on the daily, weekly, and monthly but are a bit high on the weekly and monthly. Slow stochastics are at 86 on the daily, 32 for the weekly, and 24 on the monthly. At 73.50, the price is trading in the 24% Fibonacci ratio and needs to gain momentum to clear the 38% Fibonacci at 74.14. What this says from a chart perspective is that the dollar is still hanging in the balance without a clear direction. What the dollar could use is a decent stream of economic news to push it past formidable resistance so we can say without question that the dollar is truly trending. |
| SUGGESTED READING Acree, Bryan. "Revising the Atlanta Fed's Dollar Index," Atlanta Federal Reserve Board Economic Review. Leahy, Michael P. [1998]. "New Summary Measures Of The Foreign Exchange Value Of The Dollar," Federal Reserve Bulletin, October. Loretan, Mico [2005]. "Indexes Of The Foreign Exchange Value of the Dollar," Federal Reserve Bulletin, Winter. |
Brian Twomey is a currency trader and adjunct professor of political science at Gardner-Webb University.
| E-mail address: | dbcc_twomey@yahoo.com |
PRINT THIS ARTICLE

Request Information From Our Sponsors
- StockCharts.com, Inc.
- Candle Patterns
- Candlestick Charting Explained
- Intermarket Technical Analysis
- John Murphy on Chart Analysis
- John Murphy's Chart Pattern Recognition
- John Murphy's Market Message
- MurphyExplainsMarketAnalysis-Intermarket Analysis
- MurphyExplainsMarketAnalysis-Visual Analysis
- StockCharts.com
- Technical Analysis of the Financial Markets
- The Visual Investor
- VectorVest, Inc.
- Executive Premier Workshop
- One-Day Options Course
- OptionsPro
- Retirement Income Workshop
- Sure-Fire Trading Systems (VectorVest, Inc.)
- Trading as a Business Workshop
- VectorVest 7 EOD
- VectorVest 7 RealTime/IntraDay
- VectorVest AutoTester
- VectorVest Educational Services
- VectorVest OnLine
- VectorVest Options Analyzer
- VectorVest ProGraphics v6.0
- VectorVest ProTrader 7
- VectorVest RealTime Derby Tool
- VectorVest Simulator
- VectorVest Variator
- VectorVest Watchdog


