HOT TOPICS LIST
- Strategies
- Stocks
- Buy
- Investing
- Brokers
- Psychology
- Interviews
- Accumulate
- Sell
- Hold
- Spotlight
- Websites
- Candlestick Corner
- Gold & Metals
- Options Trading
LIST OF TOPICS
TRADER'S NOTEBOOK
Selling The 10-Bagger
06/27/08 11:55:29 AM PSTby Thomas Maskell
The key to selling is a narrative. It's a story, composed of fundamentals, speculative foreshadowing, and technical twists and turns.
| This time in the 10-bagger series we will explore the sell decision. Like the buy decision, we will approach it from three different perspectives -- the investor, the trader, and the speculator. But first, let's look at why we sell. WHY SELL? As much as we would like to think that all our buy decisions are on the mark, most aren't. This is especially true of 10-baggers. My early articles on the subject pointed out that leading up to a successful launch, many 10-baggers have very convincing false starts. They can easily increase in price two- or threefold before falling back to their original starting point, or lower. How do you know if those falls are just pullbacks or full-fledged retreats into the abyss of the penny stocks? Preliminary studies have shown that once a 10-bagger has launched, 93% of them experience at least one price correction during their move, and 13.3% of our sample trigger a monthly moving average convergence/divergence (MACD) during that correction. Using these statistics as a guide, it is reasonable to assume that we have an 86.7% confidence level that a pullback that does not trigger the MACD is just that, a pullback -- not a reversal. There are several interesting twists to that conclusion that we will discuss later. For now, from the standpoint of correcting a mistake and protecting invested capital, waiting for a monthly MACD signal before a stock reaches 10-bag status is a reasonable corrective sell strategy. However, from the standpoint of maximizing profits, the MACD is seriously flawed. After a stock has achieved 10-bag status, the percentage of stocks that trigger the MACD during a correction actually increases to 50%. Thus, before the 10-bag point the MACD tells you when it's time to sell, but after the 10-bag point the MACD is no better than the flip of a coin. The falling stock is just as likely to go to new highs as it is to tumble into the penny stock pit. This is an especially irritating twist, considering that the average drop in price from its peak price to the MACD signal is approximately 40%. Thus, you could lose more than a third of your gains waiting for a sell signal, which turns out to be not worth the wait. Can we improve on this dismal result with a different perspective? To answer that, we will look to the fundamentals or maybe our skills as speculators.
|
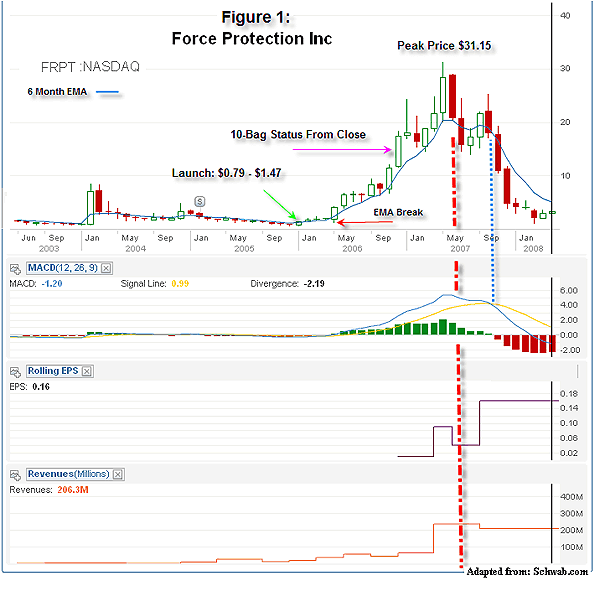
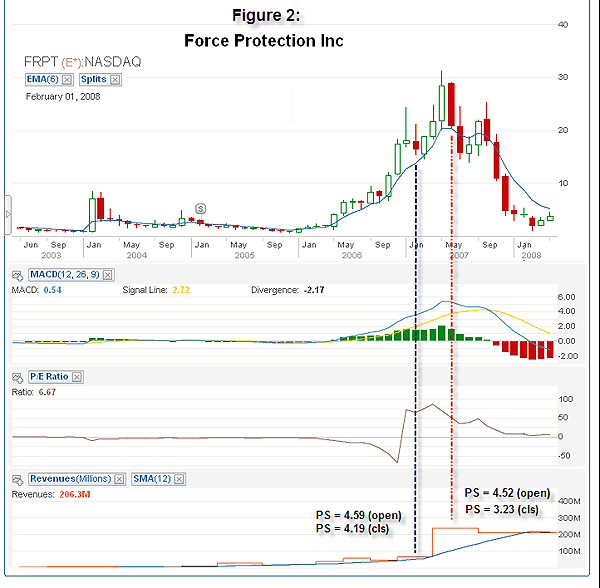
| THE FUNDAMENTALIST'S VIEW Figure 1 compares two key fundamentals (sales and earnings per share (EPS)) to the stock price of a 10-bagger. We are looking for an early warning that will signal it is time to sell at the first sign of a price decline. Unfortunately, it's not there. Figure 1 is typical of what you will see with 10-baggers. Both sales and EPS are on the rise at the time of the price downturn, similar to what was observed prior to the buy decision. The chart precedes the fundamentals. Somebody knows something, but we are not that somebody. However, we do get a little warning from the fundamentals if we convert them into valuations, in this case the price/earnings ratio (P/E). Figure 2 illustrates the P/E of a 10-bagger along with the revenue growth and calculated price/sales ratio (P/S). During the first half of 2007, the P/E ranged between 30 and 60, and the P/S was above 4.00. Compared to an industry average of just 9.1 for P/E and 0.5 for P/S (as well as an Standard & Poor's 500 P/E between 17 and 18), the price was getting in front of the fundamentals. Something had to give. |
| But selling is about timing. The valuations tell us to sell, but when? By the end of 2006, there was a significant jump in P/E, and P/S rose to 10 times the industry average. This would certainly have made any investor wary when the price declined in February 2007. But is this the beginning of the foreshadowed reverse or just a pause? If we compare what turned out to be a pause in February to the reverse that occurred in June 2007, there is little difference in the fundamentals. Both P/Es are high, as is the P/S, and the EPS and sales are still growing. But something changed between February and June that spooked the shareholders of Force Protection (FRPT) and made June the "when." THE SPECULATOR'S VIEW In a purely market sense, the flattening of the sales curve would be the bigger issue. Stock buyers place a big premium on growth. Take away the growth and the premium disappears. FRPT was approaching $1 billion in sales. With the reported arrival of competitors into their market, speculators would be asking if there was any further sales growth to be had. If they concluded there wasn't, the P/E of 50 would have to fall to 9 or 18, and it could only come from a drop in stock price. As if the sales issue wasn't enough, the company announced in March 2007 that it would have to restate past earnings. This injected another layer of uncertainty that foreshadowed the stock's decline. Given these new negative developments, a speculator would be inclined to sell at the next weak point in the stock's price rise, which occurred in June 2007.
|
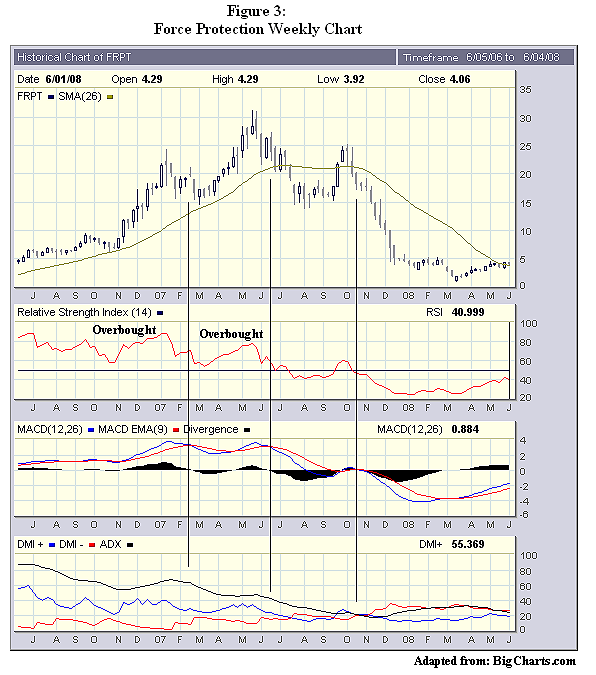
| THE TRADER'S VIEW Traders are looking for signals, and for those, a weekly chart is more instructive. Figure 3 is a two-year weekly chart of FRPT illustrating four commonly used indicators: the moving average (MA), the relative strength index (RSI), the MACD, and the directional movement index (DMI). Each indicator has its advocates; some traders use all four. All are simply a mathematical manipulation of the stock's price. The February 2007 move (which actually began in January) was preceded by an RSI overbought indication. However, it failed to penetrate the 26-week MA, which according to Justin Mamis in his book, When To Sell, is a significant sell signal, especially if the MA has turned over. The MACD was triggered, but the DMI was not. Given this indicator set, some traders might decide it was time to get out. However, the monthly chart (Figure 1) was still bullish, and our previous suggestion of selling on the monthly MACD was not met. In addition, the fundamentals were strong, and there were no speculative threats on the horizon. Thus, investors and speculators were probably not motivated to head for the exits along with the early traders. June 2007 presented a different profile and further sell signals. The valuations were skyrocketing, and there were storm clouds forming on the speculator's horizon. The stock was repeating its February decline from a new overbought position (RSI), but this time it had an additional confirmation from Mamis and the DMI in July. And while the monthly MACD did not provide firm support until September-October, it was trending downward (Figure 1). The June-July price decline gave both traders and speculators plenty of reasons to sell. Of course, a trader along the lines of John Magee would ignore the context and focus on the chart. So let's do that before we leave the trader's point of view. Let's summarize some chart observations that can be made using our entire sample of 10-baggers. These observations relate to a monthly chart. Of the 10-baggers, 29 were observed for a total of 972 months from launch to peak price. The medium number of months between launch and peak price was 36. The average was 33.5 months. Of the 972 total months:
Of the 29 10-baggers studied:
If anything, the preceding summaries illustrate that selling is not a simple formula. The key to selling is in the narrative. It's a story, one composed of fundamentals, speculative foreshadowing, and technical twists and turns. Each 10-bagger has its own unique tale, and each shareholder must be in tune with and react to that narrative. THE FRPT STORY So when do you sell? An aggressive trader would have been out in February (using the weekly chart), but the more conservative trader might wait until June, July, or October to bail. With all these exit points, the trader gives back as much as 40% of his profits. However, the speculator, with one eye on the chart and the other on the newspaper, might have moved when he saw the bearish engulfing candlestick in June. Such a quick response would have put an extra $4.00 per share in his pocket. By trading within the context of the story, the speculator can maximize his profits. The fundamentalist might still be holding the stock. After all, FRPT is, at its latest reporting, fundamentally strong. Its last reported quarterly sales were actually higher than its last reported annual sales. Unfortunately, the reports are old -- September 2007 for the quarter and December 2006 for the annual, which is a troublesome sign. Its latest P/E has fallen below the industry average and its P/S is now in line with its competitors. In addition, it continues to report large contracts for its products, and there is no reason to assume this will abate anytime soon. Given these fundamentals, it is possible that the fundamentalists held through the collapse. And as bad as that sounds, at $4.50 a share (its current price), they still have a three-bagger, which is a 45% annual return over three and a half years. IT'S A MYSTERY
Selling the 10-bagger is the end of a story. Anytime after it has reached 10-bag status is a good time, but the optimal time depends on its unique story and the skills of its reader. Thomas Maskell is a retired engineer and MBA with a modest nest egg, 45 years of experience managing large and small businesses, and a fundamental curiosity about the workings of the stock market. Direct comments and questions on this article to Brdgames33@aol.com. Be sure to include "10-bagger" in the subject line to avoid the tyranny of the delete key. In addition, look for Maskell's first book, The Complete Guide to Investing During Retirement, in October 2008 from Adams Media. |
| SUGGESTED READING Mamis, Justin [1994]. When To Sell, Fraser Publishing. Maskell, Thomas [2008]. "The 10-Bagger Prelaunch," Technical Analysis of STOCKS & COMMODITIES, Volume 26: July. _____ [2008]."Speculating With The 10-Bagger," Technical Analysis of STOCKS & COMMODITIES, Volume 26: April. _____ [2007]. "Trading The 10-Bagger," Working-Money.com, December 4. _____ [2007]. "Search For The 10-Bagger Fundamentals," Working-Money.com, July 3. _____ [2006]. "The Anatomy Of The 10-Bagger," Working-Money.com, September 5. _____ [2006]. "The Search For The 10-Bagger Begins," Working-Money.com, March 23. |
Thomas Maskell is a frequent S&C contributor whose recent book, The Complete Guide to Investing During Retirement, provides an excellent primer on investing, trading and speculation in the stock market. It is available nationwide. To comment on this article or his book, contact him at Retireestocks@aol.com or visit his blog at retireestocks.blogspot.com.
| E-mail address: | Retireestocks@aol.com |
PRINT THIS ARTICLE

|

Request Information From Our Sponsors
- StockCharts.com, Inc.
- Candle Patterns
- Candlestick Charting Explained
- Intermarket Technical Analysis
- John Murphy on Chart Analysis
- John Murphy's Chart Pattern Recognition
- John Murphy's Market Message
- MurphyExplainsMarketAnalysis-Intermarket Analysis
- MurphyExplainsMarketAnalysis-Visual Analysis
- StockCharts.com
- Technical Analysis of the Financial Markets
- The Visual Investor
- VectorVest, Inc.
- Executive Premier Workshop
- One-Day Options Course
- OptionsPro
- Retirement Income Workshop
- Sure-Fire Trading Systems (VectorVest, Inc.)
- Trading as a Business Workshop
- VectorVest 7 EOD
- VectorVest 7 RealTime/IntraDay
- VectorVest AutoTester
- VectorVest Educational Services
- VectorVest OnLine
- VectorVest Options Analyzer
- VectorVest ProGraphics v6.0
- VectorVest ProTrader 7
- VectorVest RealTime Derby Tool
- VectorVest Simulator
- VectorVest Variator
- VectorVest Watchdog


