HOT TOPICS LIST
- Strategies
- Stocks
- Buy
- Investing
- Brokers
- Psychology
- Interviews
- Accumulate
- Sell
- Hold
- Spotlight
- Websites
- Candlestick Corner
- Gold & Metals
- Options Trading
LIST OF TOPICS
TRADER'S NOTEBOOK
The Trading Ecosystem
08/22/08 03:37:59 PM PSTby Pascal Willain
Have human traders become an endangered species?
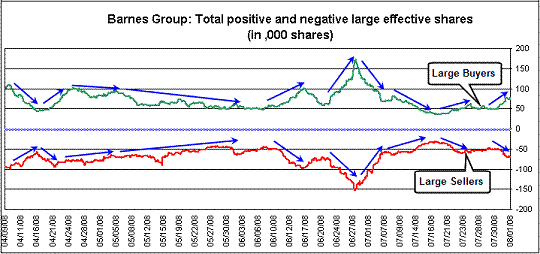
| In the ecological sense of the term, most species do not become endangered from their own actions, but often due to changes in the ecosystem. In the past decade, the entire trading ecosystem has dramatically evolved to the point where winning not only requires the best available computer engineers around, but also enough financial strength to turn the table in one's favor. Traders who rely solely on technical analysis are in danger of being wiped out simply because the tools they use do not match the evolution -- or perhaps the revolution -- of the trading ecosystem. A FEW Q'S? The main problem is that the trading environment has dramatically turned against the individual investor. DECIMALIZATION The objective of decimalization was to attract more retail investors by making the stock price fluctuations easier for the public to understand, as well as to reduce the spread cost. What regulators did not foresee is that decimalization reduced market visibility and opened the door to price manipulation. Before decimalization, since the spread was high and because of the time precedence rule that prioritizes the execution of orders -- first come, first served -- traders would place their orders early enough to be executed first. As a consequence, all the orders were accessible in the book of orders; you could have market visibility and guess what large players wanted to do. After decimalization, however, the spread cost was reduced from 6.25 cents to only one cent. In other words, the incentive for institutional players to place their orders in the book had been reduced 6.25 times. Remember, this happened in 2001, at the top of the technology boom. This decimalization rule allowed a real boom in algorithmic trading and was an implicit authorization for large funds to manipulate markets. Indeed, before decimalization, if a fund wanted to lower the price of a stock, it had to sell enough shares at the bid to take out all the outstanding buy orders. Since the spread cost was high, all players entered their orders in advance, and it was easy to see what large players wanted to do. At that time, market manipulation was also both costly and risky. Before decimalization, for example, you had to sell 10,000 shares to push the price down one tick ($0.0625), with the risk of having to buy these shares back one tick higher if your strategy did not work out. This manipulation could have cost you $625 (10,000 shares x $0.0625). Today, since there are fewer shares in the book for the same stock, you could easily push the price down one tick ($0.01) with only 1,000 shares, for a true financial risk of $10 (1,000 shares x $0.01). I have no proof that markets are constantly manipulated. However, if a service suddenly costs 60 times less than it did the day before, you can be sure that this service will be used more often. Since market visibility had basically been wiped out and since the spread cost gotten so low, the way to accumulate or distribute large numbers of shares on the market had become a pure process of adaptation to changes in liquidity. Indeed, if you want to buy 10,000 shares when only 1,000 are available at the ask, it is natural to fraction your order and drip-release it, progressively depending on the available liquidity. Further, for illiquid stocks -- on the minute level, many stocks are illiquid -- it would not be difficult to slightly push the price down in order to force the supply side of the market to show its hand and be able to acquire stocks on the cheap. Why not do that during the lunch hours? Traders need to eat while computer programs continue to operate. These trading techniques are not illegal, and I would not be surprised if they were not programmed in most institutional players' trading platforms. In order to show how dynamic this tactical adjustment to changes in liquidity has become, I performed a small experiment on Barnes Group, the aerospace and industrial products company, using one-minute data. I selected Barnes for its good overall liquidity. I analyzed Barnes for a period of 80 days, taking a rolling window of four days (about 1,500 trading minutes). For each of the minutes within the window, whenever the price changed positively from one minute to the next, I considered that the volume exchanged during that trading minute was "buying" volume; whenever the price change was negative, I considered the volume was "selling" volume. I discarded volume that did not move the price from one minute to the next. Further, since I am interested in the activities of large players, I eliminated the minutes during which the exchanged volume was lower than some defined level that is referred to as the "separation volume." I call the remaining volume the "large effective volume" (there is a chapter of my book Value In Time that discusses the mathematical aspects of the effective volume method). I then tallied the buying large effective volume separately from the selling large effective volume, during the 1,500 trading minutes of the rolling window. This process was then repeated minute-by-minute for the 80 days. The results are shown in Figure 1, which separates the positive large effective volume from the negative large effective volume. The most striking aspect of Figure 1 is that each of the two forces (buyers-sellers) seems to be the mirror of the other: whenever large players start offering shares for sale (a string of large volume pushes the price down), this attracts large buyers (a string of large volume pushes the price up). This means that the supply/demand equilibrium is a dynamic phenomenon where waves of buying and selling occur together; each side of the trade analyzes movements from the other side and adapts its own moves to the available liquidity.
|
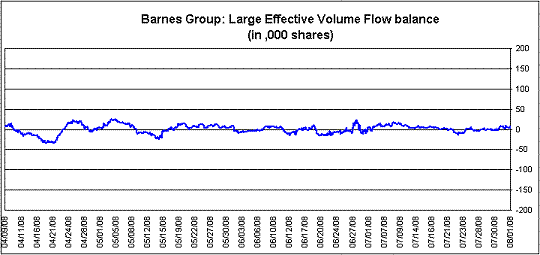
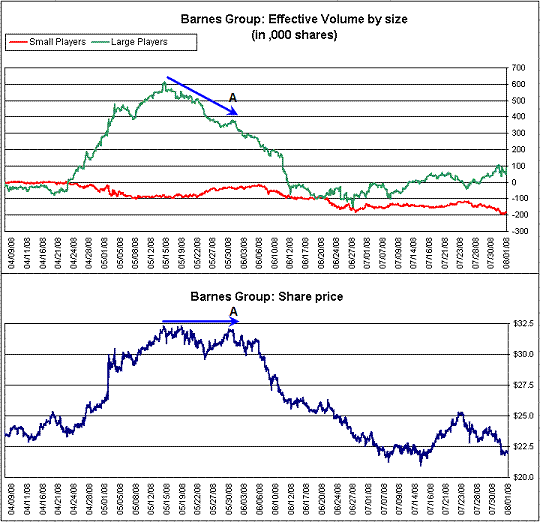
| The difference between the buying and selling trends, which is represented in Figure 2, shows how tiny the supply/demand imbalance is at any time. This means that markets are in general well-balanced. This is far from the truth, however; there are always timings of illiquidity that can be automatically computer-detected and taken advantage of. This also means that it is difficult to understand if accumulation or distribution is taking place just by looking at the punctual small demand/supply imbalances. If, however, instead of taking a rolling window, we measure the cumulative accumulation/distribution power in terms of large effective volume flow, we can see in Figure 3 that this method makes it possible to draw a specific conclusion regarding to the evolution of the demand/supply equilibrium compared to the price evolution. Leading to the double top of May 30, 2008 (see point A), large players had been strong sellers, indicating the coming selloff.
|
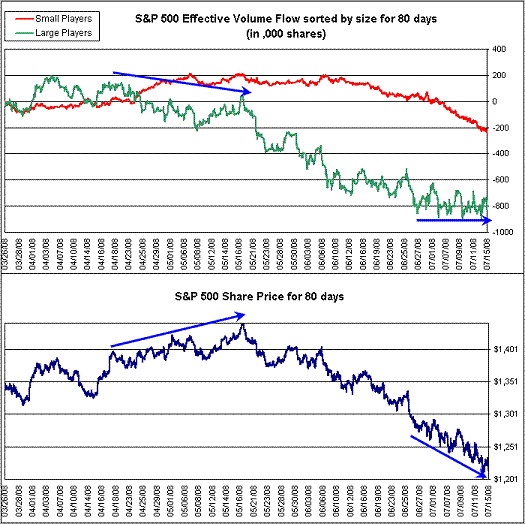
| COMPUTERS ARE IN CONTROL What Figures 1, 2, and 3 show is that today's markets are highly computer-controlled. Algorithmic trading uses strategies based on price variations, changes in liquidity and timing within a trading session. Many modern execution trading algorithms indeed use volume-weighted average pricing (VWAP) or time-weighted average pricing (TWAP) execution methods. The objective of these methods is to fraction a large order into multiple trades. The execution of such smaller orders at different times guarantees that the market price will be offered. However, because of the constant requirement for program trading algorithms to adapt their accumulation/distribution activities to an ever-changing liquidity level, it is now possible to use statistical tools in order to judge the supply/demand equilibrium. Such tools -- of which the effective volume tool that I developed is one example -- must first detect repetitive patterns of accumulation/distribution at a level that is close enough to the transactional level. In a second phase, these tools must rebuild a long-term view -- daily or weekly -- of the supply/demand balance evolution. This demand/supply evolution can be compared afterward to the price evolution in a way that leads to creating a more detailed understanding of how they interact. This type of analysis is not only limited to the stock market; the futures market is also prone to sophisticated algorithmic trading, and sometimes manipulation. Let's look at Figure 4, which shows the effective volume analysis applied to a continuous emini futures contract on the Standard & Poor's 500. We can see that large players had been net sellers since April 2008, before the market plummetted one month later and stopped selling at the beginning of July just before the August reversal.
|
| WHO WILL SURVIVE? The "death rate" amid daytraders must be phenomenal; there is no way that a human trader can match the analytic and execution power of computers. Swing traders are now in danger, because they use technical analysis tools that are no match against execution tools used by algorithmic trading. Technical analysis has not changed quickly enough compared to the evolution of the trading ecosystem. Renewed research efforts are necessary to give individual traders a chance of performing against both powerful institutional players and mighty algorithmic trading. More tools are also necessary to make cross-transactional statistical analysis of related markets: options, futures, and equities. Another great danger is also looming -- financial "black holes." These are the parallel closed markets that are developing only for institutional players, where volume transactions can take place at a discount to traditional markets. Why is this a danger? Because the price is set in the official markets while an increasing amount of volume is exchanged in these parallel markets. This is a clear recipe for price manipulation -- why not push the price down in the official market by selling small amounts of shares at periods of illiquidity, thus establishing a low price that will be used to close a huge transaction in the parallel market? WHAT SHOULD BE DONE? What can be done? The technical analysis community must get its act together and develop a new set of tools that can match the power of algorithmic trading and resolve the issue of cross-market manipulation. All the sophisticated trading execution software must go through an approval process that guarantees that they do not include price manipulation techniques. Parallel markets must be open and regulated in order to guarantee a fair market price for all. Since traditional technical analysis tools today are way off the mark and regulatory authorities have their hands full with problems in the credit markets, traders may want to mostly rely on fundamental analysis and mainly concentrate on sector trackers, which are not prone to manipulation. This is a matter of survival until technical tools are adapted to the new trading ecosystem. SUGGESTED READING |
Pascal Willain is a Belgian entrepreneur with a background in mathematics and software engineering. Visit the author at www.willain.com.
| Website: | www.willain.com |
PRINT THIS ARTICLE

Request Information From Our Sponsors
- StockCharts.com, Inc.
- Candle Patterns
- Candlestick Charting Explained
- Intermarket Technical Analysis
- John Murphy on Chart Analysis
- John Murphy's Chart Pattern Recognition
- John Murphy's Market Message
- MurphyExplainsMarketAnalysis-Intermarket Analysis
- MurphyExplainsMarketAnalysis-Visual Analysis
- StockCharts.com
- Technical Analysis of the Financial Markets
- The Visual Investor
- VectorVest, Inc.
- Executive Premier Workshop
- One-Day Options Course
- OptionsPro
- Retirement Income Workshop
- Sure-Fire Trading Systems (VectorVest, Inc.)
- Trading as a Business Workshop
- VectorVest 7 EOD
- VectorVest 7 RealTime/IntraDay
- VectorVest AutoTester
- VectorVest Educational Services
- VectorVest OnLine
- VectorVest Options Analyzer
- VectorVest ProGraphics v6.0
- VectorVest ProTrader 7
- VectorVest RealTime Derby Tool
- VectorVest Simulator
- VectorVest Variator
- VectorVest Watchdog


