HOT TOPICS LIST
- Strategies
- Stocks
- Buy
- Investing
- Brokers
- Psychology
- Interviews
- Accumulate
- Sell
- Hold
- Spotlight
- Websites
- Candlestick Corner
- Gold & Metals
- Options Trading
LIST OF TOPICS
THE CHARTIST
Trading For Targets
08/26/08 06:20:46 PM PSTby Danish Kapur
Targets can be set in many ways, and one of those ways is using previous supports and resistances.
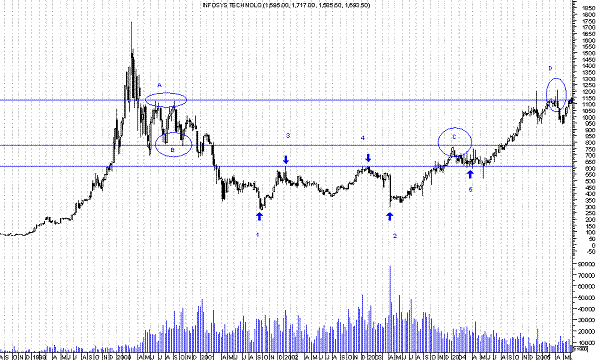
| Although it is true that no high is high in bull markets and no low is low in bear markets, setting up targets is nonetheless a good practice. It not only helps in estimating the risk/reward ratio but also helps by positioning yourself accordingly to take benefit of any contratrend opportunity, if it arises near the target zone. Targets can be set in many ways, and one of them is using previous supports and resistances. First, let us understand the concept of resistance and support. Resistance is the area where sellers are stronger than buyers, and this leads to lower prices. Support, on the other hand, is the area where buyers are stronger than sellers and push the prices up. Resistances and supports keep changing their roles. When a resistance is crossed it starts acting as support, and when support is broken on the downside, it starts acting as resistance for next up move.
|
| In the chart of Infosys Technologies (Figure 1), note the region marked as "A." This region acts as resistance and throws the stock down twice, whereas the region marked as "B" acts as support and the stock bounces two times from here. These two regions can be very useful for future trades. Here's how. The support of region B is violated and ultimately the stock drops to make low at "1." When the support is broken on the downside, it starts acting as resistance to later up moves. So when the stock starts moving up after making a bottom at "1," we can safely assume that region B will act as resistance, and hence, we should be ready to cover longs on the first sign of weakness. But the stock finds resistance well below region B at "3" and starts moving down, only to rally again and find resistance at same region 4 (extension of resistance 3). This time again the stock is unable to cross this resistance zone and starts declining. The earlier support area 1 can again act as support, and hence, it would be good idea to cover any open shorts or go long near that area. As anticipated, region 1 again provides good support and stock bounces from "2" (extension of support 1). Now the major challenge for the stock will be to cross the 3–4 region. Once this region is crossed, it will start providing good support for further up moves. This is what happened. Region 4 was crossed after which it could be a good support for future price moves. THE BATTLE CONTINUES The relationship is simple. Major support on the breakdown acts as major resistance during next up move and minor support on the breakdown acts as minor resistance during the next up move. Yes, the B region provided good resistance to the up move. As you can see on the chart, the stock declined from region C (extension of region B). But keep in mind that there is strong support at the 3-4 region. What happened is the stock held up above this support of "3-4," gained strength, and crossed the resistance area of "C." Now C has become a good support area for future price moves. The stock rallied well past C so the next area to pay attention to would be the one labeled "A," which provided resistance twice between 2000 and 2001. This A region again acted as good resistance. As you can see, the stock declined after touching the D region (extension of region A). SUPPORT OR RESISTANCE |
| SUGGESTED READING Kapur, Danish [2008]. "Swing Trading And Market Pace," At the Close, Technical Analysis of STOCKS & COMMODITIES, Volume 26: September. |
Danish Kapur is a trader, author, and commentator. He may be reached at www.danishkapur.com.
| Website: | www.danishkapur.com |
PRINT THIS ARTICLE

Request Information From Our Sponsors
- StockCharts.com, Inc.
- Candle Patterns
- Candlestick Charting Explained
- Intermarket Technical Analysis
- John Murphy on Chart Analysis
- John Murphy's Chart Pattern Recognition
- John Murphy's Market Message
- MurphyExplainsMarketAnalysis-Intermarket Analysis
- MurphyExplainsMarketAnalysis-Visual Analysis
- StockCharts.com
- Technical Analysis of the Financial Markets
- The Visual Investor
- VectorVest, Inc.
- Executive Premier Workshop
- One-Day Options Course
- OptionsPro
- Retirement Income Workshop
- Sure-Fire Trading Systems (VectorVest, Inc.)
- Trading as a Business Workshop
- VectorVest 7 EOD
- VectorVest 7 RealTime/IntraDay
- VectorVest AutoTester
- VectorVest Educational Services
- VectorVest OnLine
- VectorVest Options Analyzer
- VectorVest ProGraphics v6.0
- VectorVest ProTrader 7
- VectorVest RealTime Derby Tool
- VectorVest Simulator
- VectorVest Variator
- VectorVest Watchdog

