HOT TOPICS LIST
- Strategies
- Stocks
- Buy
- Investing
- Brokers
- Psychology
- Interviews
- Accumulate
- Sell
- Hold
- Spotlight
- Websites
- Candlestick Corner
- Gold & Metals
- Options Trading
LIST OF TOPICS
TRADER'S NOTEBOOK
Managing Your 10-Bagger Portfolio
10/01/08 12:27:44 PM PSTby Thomas Maskell
It's a lofty goal to go for a 10-fold increase in the price of a stock, but is it realistic?
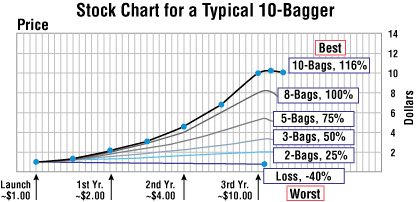
| Over the past seven articles we have defined, analyzed, purchased, and sold the 10-bagger. All our work went toward one end: to reap the rewards of a 10-fold increase in the stock's price. It is a lofty goal, but is it realistic? LOOKING AHEAD When it comes to 10-baggers, we strive for the best. The best can make a poor man rich. Conversely, we should avoid the worst, which will make us poorer, or even worse, fearful. More often than not, we will achieve neither best nor worst. We will end up somewhere in the middle, but where is that middle? In this, our final 10-bagger installment, we will answer that question. LINKING PAST TO FUTURE The best outcome is that all our picks will be 10-baggers. The worst is that all our picks will be losers from the point of purchase. And the most likely is a reasonable portfolio of the best, the worst, and the in-betweens. It is this most likely outcome that will define the potential success or failure of our 10-bag strategy. We can build this most likely outcome by combining what we know about 10-baggers with a weighted average analysis. However, it is important to note that what we know about 10-baggers is situational; it is different for different types of markets. In a bull market there will be more 10-baggers, more advancers, and fewer decliners. A bearish market will provide a very different ratio of 10-baggers, advancers, and decliners. The example given here is based on the market conditions that were in effect at the time the study began (2006). While our goal is to catch a string of 10-baggers, at a minimum, we want to do no harm. Since the stock market provides, over the long term, a 12% return, our 10-bag portfolio should offer an average return that is between the market average (12%) and the typical annual return of a 10-bagger (116%). THE BEST AND WORST 1 The market will continue to perform as it did when we gathered our data. In this case, it was a flat market. Any or all of these assumptions can be modified to fit your trading strategy. For instance, you could choose to buy using the monthly chart but sell using the weekly chart. You could choose to sell at the 10-bag point only after the point has been crossed in the hopes of capitalizing on a 20-, 30-, or 50-bagger. These are assumptions, which means, with the exception of #1, they are strategic elements that you control. Let's develop a weighted 10-bag portfolio using these assumptions. First, the best-case scenario: Best case: All of our picks are 10-baggers yielding a typical annual return of 116%. 100% of the portfolio x 116 annual return (1.00 x 116%) = 116% annual portfolio return In the best case, if every one of our stock picks were 10-baggers, our annual return on our total portfolio would be 116%, well above our minimum goal of 12%. Let's look at the worst case. In this case, we anticipate that the stock will decline from our buy point and trigger a moving average convergence/divergence (MACD) sell signal. Our analysis of the MACD sell signal indicated that the 10-bagger's price declines as much as 40% before it is triggered. We'll use this 40% for our analysis: Worst case: All of our picks will immediately decline yielding an annual return of -40%. 100% of the portfolio x -40 annual return (1.00 x -40%) = -40% annual portfolio return MOST LIKELY SCENARIO
|
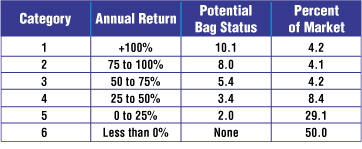
| We'll begin by creating a table (Figure 2), which is based on some of the data that we uncovered in our previous articles on the 10-bagger.
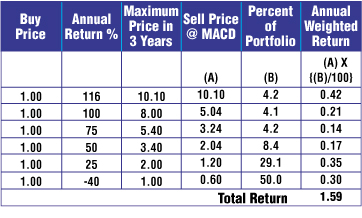
Using this data, we can construct another table based on a three-year scenario. Here we will assume that all the stocks in the portfolio trigger their sell point. This would not normally be the case, but it allows us to make the calculation. We also have to choose a specific return rate for each category. We will choose 116% for the 10-baggers and the high end of the range for the others. We can now build the table shown in Figure 3.
|
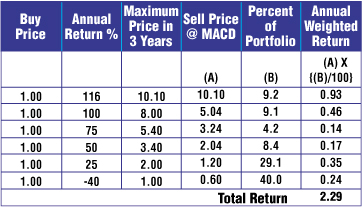
| The weighted return in the table is a three-year return assuming a $1.00 investment. To convert it to an annual return will require a compound interest rate table. Consulting the table yields an annual return rate of about 17%. Clearly, our 10-bagger portfolio has done no harm. It has surpassed the long-term market return (12%) by 42%. And that was accomplished based on a random screening of the market. But what if our stock picks were not random? What if we applied what we have learned about 10-baggers to increase the accuracy of our picks? Figure 4 illustrates a 10-bagger portfolio that is not based on a random distribution of stocks. It is based on a select distribution that increases the number of high-end performers and reduces the number of low-end losers. This is achieved by applying some of the attributes of 10-baggers that we have discovered in our research. Attributes include price/sales below 1.00, gross margin above 35%, and volume confirmation at launch. By combining these and other attributes we can reasonably expect our portfolio to outperform the random one.
|
| Our annual return on this portfolio is 32%, almost three times the long-term rate for the market. This entire portfolio will increase 10-fold in less than eight and a half years. Even with 40% of the picks being losers, a $5,000 investment based on Figure 4 will make you a millionaire in just over 19 years. The data in Figure 4 is just one of many possibilities. For instance, what would your annual return be if you limited your downside to -30%? What if your selection process was conservative enough to eliminate any immediate downturn stocks? The analysis can be made as complex or as simple as you want and your skills as a stock picker allows. This is all about you: your strategy, your analysis, and your picks. AIM FOR THE STARS |
| SUGGESTED READING Maskell, Thomas [2008]. The Complete Guide To Investing During Retirement, Adams Media. _____ [2008]."Selling The 10-Bagger," Technical Analysis of STOCKS & COMMODITIES, Volume 26: September. _____ [2008]."The 10-Bagger Prelaunch," Technical Analysis of STOCKS & COMMODITIES, Volume 26: July. _____ [2008]."Speculating With The 10-Bagger," Technical Analysis of STOCKS & COMMODITIES, Volume 26: April. _____ [2007]. "Trading The 10-Bagger," Working-Money.com, December 4. _____ [2007]. "Search For The 10-Bagger Fundamentals," Working-Money.com, July 3. _____ [2006]. "The Anatomy Of The 10-Bagger," Working-Money.com, September 5. _____ [2006]. "The Search For The 10-Bagger Begins," Working-Money.com, March 23. |
Thomas Maskell is a frequent S&C contributor whose recent book, The Complete Guide to Investing During Retirement, provides an excellent primer on investing, trading and speculation in the stock market. It is available nationwide. To comment on this article or his book, contact him at Retireestocks@aol.com or visit his blog at retireestocks.blogspot.com.
| E-mail address: | Retireestocks@aol.com |
PRINT THIS ARTICLE

Request Information From Our Sponsors
- StockCharts.com, Inc.
- Candle Patterns
- Candlestick Charting Explained
- Intermarket Technical Analysis
- John Murphy on Chart Analysis
- John Murphy's Chart Pattern Recognition
- John Murphy's Market Message
- MurphyExplainsMarketAnalysis-Intermarket Analysis
- MurphyExplainsMarketAnalysis-Visual Analysis
- StockCharts.com
- Technical Analysis of the Financial Markets
- The Visual Investor
- VectorVest, Inc.
- Executive Premier Workshop
- One-Day Options Course
- OptionsPro
- Retirement Income Workshop
- Sure-Fire Trading Systems (VectorVest, Inc.)
- Trading as a Business Workshop
- VectorVest 7 EOD
- VectorVest 7 RealTime/IntraDay
- VectorVest AutoTester
- VectorVest Educational Services
- VectorVest OnLine
- VectorVest Options Analyzer
- VectorVest ProGraphics v6.0
- VectorVest ProTrader 7
- VectorVest RealTime Derby Tool
- VectorVest Simulator
- VectorVest Variator
- VectorVest Watchdog


