HOT TOPICS LIST
- Strategies
- Stocks
- Buy
- Investing
- Brokers
- Psychology
- Interviews
- Accumulate
- Sell
- Hold
- Spotlight
- Websites
- Candlestick Corner
- Gold & Metals
- Options Trading
LIST OF TOPICS
TRADER'S NOTEBOOK
Weinstein's Theory Of Relativity
10/29/08 04:13:50 PM PSTby Larry Swing
This simple but effective method is for long-term investors who don't and can't commit to the market full time.
| When trader Stan Weinstein was first featured in Market Wizards by Jack Schwager, he stood out as a trader with the highest win/loss ratio. He finally revealed his method in his only book (thus far), Secrets For Profiting In Bull And Bear Markets, for the long-term investors. This informative book covers many aspects of trading, including dos and don'ts as well as a single methodology to find the right stocks with setups to enter and exit. This book is mainly for investors and traders. An investor holds a position for at least three months, while a trader trades two to three times a month. His method is helpful for swing and position traders but not necessarily for daytraders. Weinstein's method requires a few simple indicators and tools to make the method work, including:
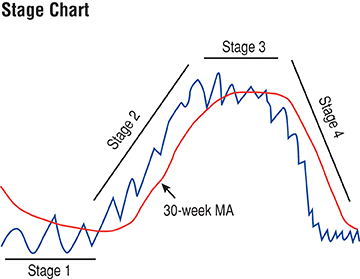
To find the right stocks: 1. Identify what stage the market is in. In Figure 1, Weinstein categorizes the stages of the market: uptrend, consolidation, downtrend, consolidation. Stages 1 and 3 are consolidation phases, while stages 2 and 4 are trending phases.
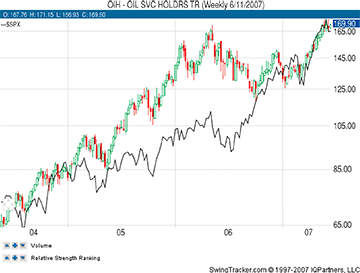
2. Search for the sector with strength. Compare the sector to the broader indexes such as Dow Jones Industrial Average or the Standard & Poor's 500. See Figure 2.
|
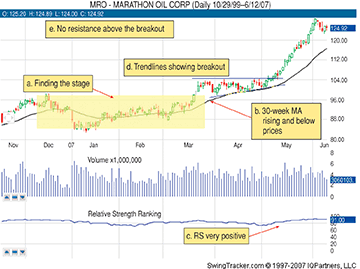
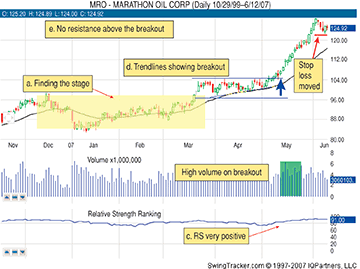
| If you are going long, the first task is to find the sector that is outperforming the indexes. The best way to do this is to compare the sector with the indexes using charts. You may find situations where the index is weak or weakening (by either moving sideways or downward) while the sector is getting stronger (trending upward). Figure 2 shows the divergence in strength between sector and index. Once you find the sector that is showing strength (in a bull market) or weakness (in a bear market) relative to the index, the next step is to check the charts in that sector and find the strongest stock. Here are the steps you need to go through (see Figure 3):
|
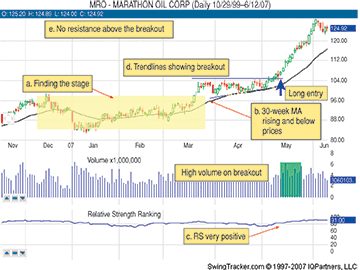
Once you identify the best trading candidates, you should enter the trade on high volume at the trendline breakout. High volume at the breakout will determine if the stock has enough interest to continue higher. This is an important criterion when taking a position. With little or no volume, the breakout cannot be trusted. Once you do place a trade, remember that a stop-loss must be in place when you take your position. The stop-loss should be below the last correction low (see Figure 4).
|
| Exiting a position happens when the stage has changed from trending in one direction to another. The stops are placed just below the last correction low. As the stock moves higher to a new high, the stop is moved to the last low (Figure 5).
|
| This is a simple but effective method for long-term investors who do not and cannot commit to studying or watching the market full time. The method I have discussed requires a commitment of a couple of weekends and only really needs to be checked once a week to keep abreast of the new market price action. SUGGESTED READING |
Larry Swing is the president of the day- and swing trading site www.mrswing.com, where free daily articles and videos on education, market analysis, and picks from Swing and other well-known traders can be found.
| Website: | www.mrswing.com |
PRINT THIS ARTICLE

Request Information From Our Sponsors
- StockCharts.com, Inc.
- Candle Patterns
- Candlestick Charting Explained
- Intermarket Technical Analysis
- John Murphy on Chart Analysis
- John Murphy's Chart Pattern Recognition
- John Murphy's Market Message
- MurphyExplainsMarketAnalysis-Intermarket Analysis
- MurphyExplainsMarketAnalysis-Visual Analysis
- StockCharts.com
- Technical Analysis of the Financial Markets
- The Visual Investor
- VectorVest, Inc.
- Executive Premier Workshop
- One-Day Options Course
- OptionsPro
- Retirement Income Workshop
- Sure-Fire Trading Systems (VectorVest, Inc.)
- Trading as a Business Workshop
- VectorVest 7 EOD
- VectorVest 7 RealTime/IntraDay
- VectorVest AutoTester
- VectorVest Educational Services
- VectorVest OnLine
- VectorVest Options Analyzer
- VectorVest ProGraphics v6.0
- VectorVest ProTrader 7
- VectorVest RealTime Derby Tool
- VectorVest Simulator
- VectorVest Variator
- VectorVest Watchdog

